Chart.js - How to set animation speed?
Solution 1
I love Chart.js, but this is definitely a part of the API that could stand to be improved for the sake of clarity.
Chart.js uses the window.requestAnimationFrame() method for animations, which is a more modern and efficient way to animate in the browser, since it only redraws on each screen refresh (i.e., based on the screen refresh rate, usually 60Hz). That prevents a lot of unnecessary calculations for frames that will never actually render.
At 60 frames/second, one frame lasts 16-2/3 milliseconds (1000ms / 60). Chart.js appears to round this off to 17ms, though. The API allows you to specify the number of steps globally, e.g.:
Chart.defaults.global.animationSteps = 60;
new Chart(ctx).Doughnut(data, {
  animationSteps: 60
});
Multiply 60 steps by 17ms/frame and your animation will run 1020ms, or just over one second. Since JavaScript programmers are used to thinking in milliseconds (not frames at 60Hz), to convert the other way, just divide by 17 to get the number of steps, e.g.:
Chart.defaults.global.animationSteps = Math.round(5000 / 17); // results in 294 steps for a 5-second animation
Hope that helps. I'm not sure what would cause those weird artifacts, though.
Solution 2
Use the animation object
options: {
        animation: {
            duration: 2000,
        },
I haven't see this documented anywhere, but it's incredibly helpful to not have to set the speed globally for every chart.
Related videos on Youtube
jlmmns
Updated on July 09, 2022Comments
-
 jlmmns 5 months
I'm using Chart.js (documentation), but there doesn't seem to be an option to set the animation speed.
I can't even seem to find an animation speed / time variable in the source code.
How do I go about doing this?
(ps: I'm using Doughnut charts)
EDIT: Changing
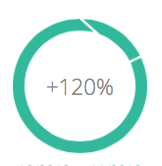
animationSteps, shows weird artefacts after the animation is complete, for several values (ie: 30 or 75). 60 is working fine. And it doesn't only appear with 100+ values of the chart:
-
 VoronoiPotato about 9 yearsHave you tried changing the animationSteps?
-
-
 JAT86 about 2 yearsThis does not seem to have an effect anymore. Solution by rcbjmbadb using
animation: {duration: 2000,},works though.


