Chart.js v2 - hiding grid lines
164,934
Solution 1
I found a solution that works for hiding the grid lines in a Line chart.
Set the gridLines color to be the same as the div's background color.
var options = {
    scales: {
        xAxes: [{
            gridLines: {
                color: "rgba(0, 0, 0, 0)",
            }
        }],
        yAxes: [{
            gridLines: {
                color: "rgba(0, 0, 0, 0)",
            }
        }]
    }
}
or use
var options = {
    scales: {
        xAxes: [{
            gridLines: {
                display:false
            }
        }],
        yAxes: [{
            gridLines: {
                display:false
            }
        }]
    }
}
Solution 2
options: {
    scales: {
        xAxes: [{
            gridLines: {
                drawOnChartArea: false
            }
        }],
        yAxes: [{
            gridLines: {
                drawOnChartArea: false
            }
        }]
    }
}
Solution 3
From version 3.x, onwards use this syntax. Refer to chart.js migration guide: https://www.chartjs.org/docs/latest/getting-started/v3-migration.html
scales: {
  x: {
    grid: {
      display: false
    }
  },
  y: {
    grid: {
      display: false
    }
  }
}
Solution 4
If you want them gone by default, you can set:
Chart.defaults.scale.gridLines.display = false;
Solution 5
If you want to hide gridlines but want to show yAxes, you can set:
yAxes: [{...
         gridLines: {
                        drawBorder: true,
                        display: false
                    }
       }]
Related videos on Youtube
 12 : 20
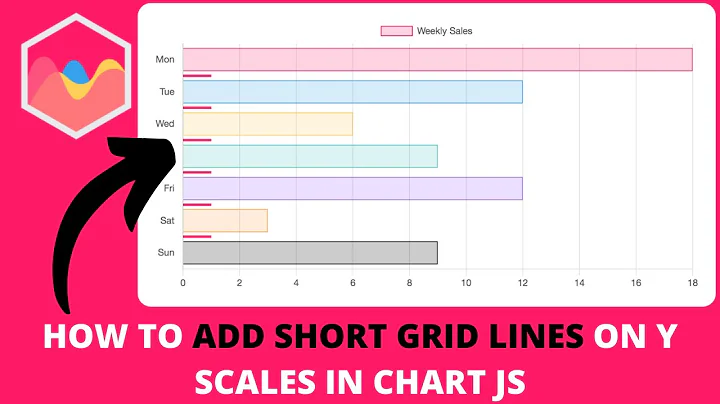
How to Add Short Grid Lines on Y Scales in Chart JS
 12 : 23
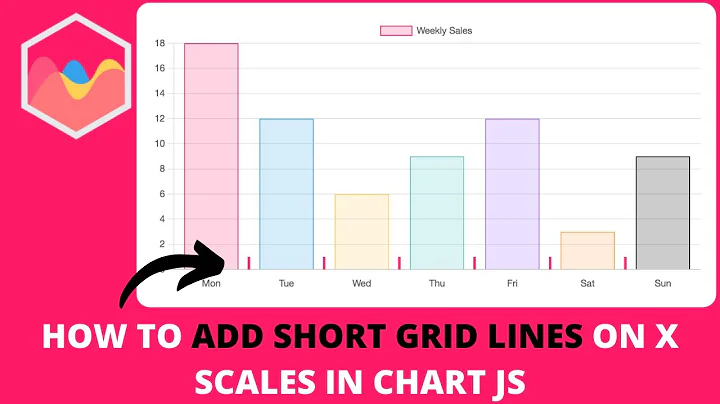
How to Add Short Grid Lines on X Scales in Chart JS
 02 : 41
Chart.js 2.0 Tutorial - Scales and GridLines
 04 : 49
How to hide gridlines in Chart.js 3
 01 : 30
JavaScript : Chart.js v2 - hiding grid lines
 04 : 39
Grid lines Chart JS 3 | ChartJS 3
 01 : 17
Chart.js v2 - hiding grid lines - JavaScript
Comments
-
iSS over 2 years
I am using Chart.js v2 to draw a simple line chart. Everything looks fine, except there are grid lines that I don't want:

The documentation for Line Chart is here: https://nnnick.github.io/Chart.js/docs-v2/#line-chart, but I can't find anything about hiding those "Grid Lines".
How can I remove the grid lines?
-
adg over 5 yearsThis answer allowed me to keep the scale but not draw the gridlines on the chart.
-
 Ranny over 3 yearsThis is the correct answer since this is not change anything out the draw area, Thanks Ahmed
 -
 D Dimitrov over 3 yearsI think this is rather the better answer.
 -
 Kalimah over 3 yearsGood answer. This is cleaner though:
Chart.defaults.scale.gridLines.drawOnChartArea = false; -
Game Unity almost 3 yearsThis should be voted higher. I was wondering why none of the answers above were working!
-
tilly over 2 yearsIndeed august 2021, the accepted answers didn't work anymore, but this one did.
-
user906573 over 2 yearsHristo, next time, could you please point to the documentation of the library to help guide the person asking the question. Thank you so much for taking the time.
-
Garavani over 2 years@Kalimah: the above (in options) code worked for me. The “cleaner” solution does not work for me with “chartjs-chart-error-bars” plugin
-
 Ali Bayat Mokhtari about 2 yearsThis should be the accepted answer
 -
Ashiq Dey about 2 yearsI was wondering why other solutions are throwing error "Invalid scale configuration for scale: xAxes" it because of version. Chart.js 3+ options are different than that of older version.