Fast Algorithm for computing percentiles to remove outliers
Solution 1
The histogram solution from Henrik will work. You can also use a selection algorithm to efficiently find the k largest or smallest elements in an array of n elements in O(n). To use this for the 95th percentile set k=0.05n and find the k largest elements.
Reference:
http://en.wikipedia.org/wiki/Selection_algorithm#Selecting_k_smallest_or_largest_elements
Solution 2
According to its creator a SoftHeap can be used to:
compute exact or approximate medians and percentiles optimally. It is also useful for approximate sorting...
Solution 3
I used to identify outliers by calculating the standard deviation. Everything with a distance more as 2 (or 3) times the standard deviation from the avarage is an outlier. 2 times = about 95%.
Since your are calculating the avarage, its also very easy to calculate the standard deviation is very fast.
You could also use only a subset of your data to calculate the numbers.
Solution 4
You could estimate your percentiles from just a part of your dataset, like the first few thousand points.
The Glivenko–Cantelli theorem ensures that this would be a fairly good estimate, if you can assume your data points to be independent.
Solution 5
Divide the interval between minimum and maximum of your data into (say) 1000 bins and calculate a histogram. Then build partial sums and see where they first exceed 5000 or 95000.
Eamon Nerbonne
My work and hobby concern programming: I'm interested in data-mining, and enjoy collecting interesting stats from last.fm's openly accessible web-services. Open source libraries: ValueUtils (nuget: ValueUtils) provides a .NET base class for ValueObjects with auto-implemented GetHashCode and Equals using runtime code generation to perform similar to hand-rolled versions. Can also generate hash function and equality delegates for other types. ExpressionToCode (nuget: ExpressionToCodeLib) generates C# source code from LINQ expression trees and can annotate that code with runtime values, which is hopefully useful in Unit Testing (integrates with NUnit, xUnit.net & mstest, but runs fine without a unit test framework too). a-vs-an (nuget: AvsAn) determines whether "a" or "an" is more appropriate before a word, symbol, or acronym. Fast & accurate. Uses real-world statistics aggregated from wikipedia, and can therefore deal well even with cases that might trip up rules-based systems (e.g. an NSA analyst vs. a NASA flight plan). Includes a C# and Javascript implementation; the javascript implementation you can try online.
Updated on June 24, 2022Comments
-
Eamon Nerbonne almost 2 years
I have a program that needs to repeatedly compute the approximate percentile (order statistic) of a dataset in order to remove outliers before further processing. I'm currently doing so by sorting the array of values and picking the appropriate element; this is doable, but it's a noticable blip on the profiles despite being a fairly minor part of the program.
More info:
- The data set contains on the order of up to 100000 floating point numbers, and assumed to be "reasonably" distributed - there are unlikely to be duplicates nor huge spikes in density near particular values; and if for some odd reason the distribution is odd, it's OK for an approximation to be less accurate since the data is probably messed up anyhow and further processing dubious. However, the data isn't necessarily uniformly or normally distributed; it's just very unlikely to be degenerate.
- An approximate solution would be fine, but I do need to understand how the approximation introduces error to ensure it's valid.
- Since the aim is to remove outliers, I'm computing two percentiles over the same data at all times: e.g. one at 95% and one at 5%.
- The app is in C# with bits of heavy lifting in C++; pseudocode or a preexisting library in either would be fine.
- An entirely different way of removing outliers would be fine too, as long as it's reasonable.
- Update: It seems I'm looking for an approximate selection algorithm.
Although this is all done in a loop, the data is (slightly) different every time, so it's not easy to reuse a datastructure as was done for this question.
Implemented Solution
Using the wikipedia selection algorithm as suggested by Gronim reduced this part of the run-time by about a factor 20.
Since I couldn't find a C# implementation, here's what I came up with. It's faster even for small inputs than Array.Sort; and at 1000 elements it's 25 times faster.
public static double QuickSelect(double[] list, int k) {
    return QuickSelect(list, k, 0, list.Length);
}
public static double QuickSelect(double[] list, int k, int startI, int endI) {
    while (true) {
        // Assume startI <= k < endI
        int pivotI = (startI + endI) / 2; //arbitrary, but good if sorted
        int splitI = partition(list, startI, endI, pivotI);
        if (k < splitI)
            endI = splitI;
        else if (k > splitI)
            startI = splitI + 1;
        else //if (k == splitI)
            return list[k];
    }
    //when this returns, all elements of list[i] <= list[k] iif i <= k
}
static int partition(double[] list, int startI, int endI, int pivotI) {
    double pivotValue = list[pivotI];
    list[pivotI] = list[startI];
    list[startI] = pivotValue;

    int storeI = startI + 1;//no need to store @ pivot item, it's good already.
    //Invariant: startI < storeI <= endI
    while (storeI < endI && list[storeI] <= pivotValue) ++storeI; //fast if sorted
    //now storeI == endI || list[storeI] > pivotValue
    //so elem @storeI is either irrelevant or too large.
    for (int i = storeI + 1; i < endI; ++i)
        if (list[i] <= pivotValue) {
            list.swap_elems(i, storeI);
            ++storeI;
        }
    int newPivotI = storeI - 1;
    list[startI] = list[newPivotI];
    list[newPivotI] = pivotValue;
    //now [startI, newPivotI] are <= to pivotValue && list[newPivotI] == pivotValue.
    return newPivotI;
}
static void swap_elems(this double[] list, int i, int j) {
    double tmp = list[i];
    list[i] = list[j];
    list[j] = tmp;
}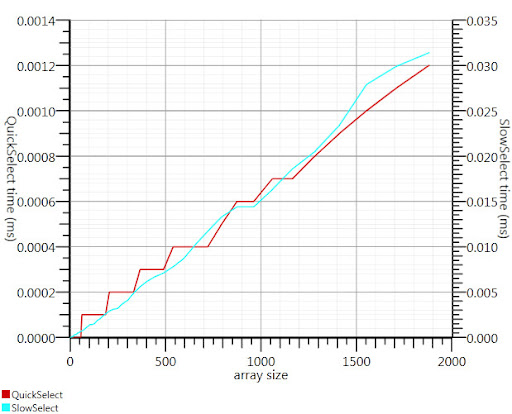
Thanks, Gronim, for pointing me in the right direction!
-
John over 13 yearsNice ... quicksort, and cut off the top and bottom 5000. Without knowing the distribution don't know how you could do better.
-
Eamon Nerbonne over 13 yearsThe first suggestion isn't throwing out the outer 5th percentiles but doing something based on the most extreme outliers which is highly unstable. The second suggestion makes the assumption that the data is normally distributed, which it explicitly is not.
-
Brian over 13 yearsBucket sort is more appropriate for this.
-
Eamon Nerbonne over 13 yearsUnfortunately, the data points are not independant, they are sorted by external criteria - but I could iterate in random order. I don't understand how the linked theorem would practically let me estimate the percentiles - can you give an example, e.g. for the normal distribution?
-
Eamon Nerbonne over 13 yearsThe data is not normally distributed.
-
Eamon Nerbonne over 13 yearsThis sounds eminently practical, albeit not always effective. A few extreme outliers could really distort your bins...
-
Eamon Nerbonne over 13 yearsRight, that's what I was looking for - a selection algorithm!
-
Eamon Nerbonne over 13 yearsI've got a set of numbers - not some complex model - RANSAC looks like it'd be slow and error prone and than for such a simple case better solutions exist.
-
Eamon Nerbonne over 13 yearsIf data is located mostly in the extremes - i.e. the opposite of normal, if you will - then this approach may remove large sets of data. I really don't want to remove more than small fraction of the data, and preferably only that when these are outliers. I'm suppressing outliers because they're distracting - they're just cropped from the visualization, not from the actual data.
-
Eugen Constantin Dinca over 13 years@Eamon the whole idea behind the SoftHeap and it's applications are really cool.
-
Jens over 13 years@Eamon: The linked theorem simply states, that the empirical distribution function (which you'd use implicitely when calculating percentiles based on data) is a good estimate for the real distribution. You don't have to use it actually =)
-
Eamon Nerbonne over 13 yearsAhh, OK, I see what you mean :-)
-
MSalters over 13 yearsBy definition, only a small fraction of your data can be in the extremes. Per Chebyshev's inequality, only 1/9th of your distribution can be more than 3 standard deviations away; only 1/16th can be 4 deviations away. And those limits are only reached in the degenerate case where your distribtuion is just two spikes. So, calculating the deviation in O(N) is a valid and efficient way to filter outliers.
-
Legend over 11 years@EugenConstantinDinca: Thanks for the great idea! Is there an actual implementation of this somewhere or the paper/wiki are the only sources?
-
Eugen Constantin Dinca over 11 years@Legend I've found a few implementations of it in various languages (from C++ to Haskell) but have'n used any so I have no idea how useful/usable they are.
-
Legend over 11 years@EugenConstantinDinca: Oh I see. Thanks for the info.
-
Eamon Nerbonne about 11 years@MSalters: (yes replying to a 3-year old comment): chebyshev's inequality isn't precise enough to be practical. To crop to at least 95% of the dataset I'd need to do 4.5 sigmas; but if the data happened to be normal i'd be showing 99.999% of the data - a far cry from the target. Put another way, I'd be zoomed out too far by a factor 2.25, i.e. showing 5 times more area than necessary thus leaving the interesting bits tiny. And if the data is spikier than normal, it's even worse. So, sure, this could be an absolute bare minimum, but it's not a great approximation.