Grouping data by value ranges
Solution 1
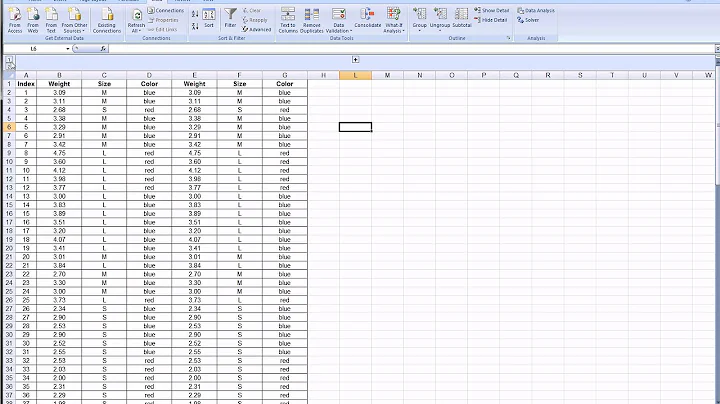
Suppose you start with this data:
df = pd.DataFrame({'ID': ('STRSUB BOTDWG'.split())*4,
                   'Days Late': [60, 60, 50, 50, 20, 20, 10, 10],
                   'quantity': [56, 20, 60, 67, 74, 87, 40, 34]})
#    Days Late      ID  quantity
# 0         60  STRSUB        56
# 1         60  BOTDWG        20
# 2         50  STRSUB        60
# 3         50  BOTDWG        67
# 4         20  STRSUB        74
# 5         20  BOTDWG        87
# 6         10  STRSUB        40
# 7         10  BOTDWG        34
Then you can find the status category using pd.cut. Note that by default, pd.cut splits the Series df['Days Late'] into categories which are half-open intervals, (-1, 14], (14, 35], (35, 56], (56, 365]:
df['status'] = pd.cut(df['Days Late'], bins=[-1, 14, 35, 56, 365], labels=False)
labels = np.array('White Yellow Amber Red'.split())
df['status'] = labels[df['status']]
del df['Days Late']
print(df)
#        ID  quantity  status
# 0  STRSUB        56     Red
# 1  BOTDWG        20     Red
# 2  STRSUB        60   Amber
# 3  BOTDWG        67   Amber
# 4  STRSUB        74  Yellow
# 5  BOTDWG        87  Yellow
# 6  STRSUB        40   White
# 7  BOTDWG        34   White
Now use pivot to get the DataFrame in the desired form:
df = df.pivot(index='ID', columns='status', values='quantity')
and use reindex to obtain the desired order for the rows and columns:
df = df.reindex(columns=labels[::-1], index=df.index[::-1])
Thus,
import numpy as np
import pandas as pd

df = pd.DataFrame({'ID': ('STRSUB BOTDWG'.split())*4,
                   'Days Late': [60, 60, 50, 50, 20, 20, 10, 10],
                   'quantity': [56, 20, 60, 67, 74, 87, 40, 34]})
df['status'] = pd.cut(df['Days Late'], bins=[-1, 14, 35, 56, 365], labels=False)
labels = np.array('White Yellow Amber Red'.split())
df['status'] = labels[df['status']]
del df['Days Late']
df = df.pivot(index='ID', columns='status', values='quantity')
df = df.reindex(columns=labels[::-1], index=df.index[::-1])
print(df)
yields
        Red  Amber  Yellow  White
ID
STRSUB   56     60      74     40
BOTDWG   20     67      87     34
Solution 2
You can create a column in your DataFrame based on your Days Late column by using the map or apply functions as follows. Let's first create some sample data.
df = pandas.DataFrame({ 'ID': 'foo,bar,foo,bar,foo,bar,foo,foo'.split(','),
                        'Days Late': numpy.random.randn(8)*20+30})

   Days Late   ID
0  30.746244  foo
1  16.234267  bar
2  14.771567  foo
3  33.211626  bar
4   3.497118  foo
5  52.482879  bar
6  11.695231  foo
7  47.350269  foo
Create a helper function to transform the data of the Days Late column and add a column called Code.
def days_late_xform(dl):
    if dl > 56: return 'Red'
    elif 35 < dl <= 56: return 'Amber'
    elif 14 < dl <= 35: return 'Yellow'
    elif 0 < dl <= 14: return 'White'
    else: return 'None'

df["Code"] = df['Days Late'].map(days_late_xform)

   Days Late   ID    Code
0  30.746244  foo  Yellow
1  16.234267  bar  Yellow
2  14.771567  foo  Yellow
3  33.211626  bar  Yellow
4   3.497118  foo   White
5  52.482879  bar   Amber
6  11.695231  foo   White
7  47.350269  foo   Amber
Lastly, you can use groupby to aggregate by the ID and Code columns, and get the counts of the groups as follows:
g = df.groupby(["ID","Code"]).size()
print g

ID   Code
bar  Amber     1
     Yellow    2
foo  Amber     1
     White     2
     Yellow    2

df2 = g.unstack()
print df2

Code  Amber  White  Yellow
ID
bar       1    NaN       2
foo       1      2       2
Solution 3
I know this is coming a bit late, but I had the same problem as you and wanted to share the function np.digitize. It sounds like exactly what you want.
a = np.random.randint(0, 100, 50)
grps = np.arange(0, 100, 10)
grps2 = [1, 20, 25, 40]
print a
[35 76 83 62 57 50 24  0 14 40 21  3 45 30 79 32 29 80 90 38  2 77 50 73 51
 71 29 53 76 16 93 46 14 32 44 77 24 95 48 23 26 49 32 15  2 33 17 88 26 17]

print np.digitize(a, grps)
[ 4  8  9  7  6  6  3  1  2  5  3  1  5  4  8  4  3  9 10  4  1  8  6  8  6
  8  3  6  8  2 10  5  2  4  5  8  3 10  5  3  3  5  4  2  1  4  2  9  3  2]

print np.digitize(a, grps2)
[3 4 4 4 4 4 2 0 1 4 2 1 4 3 4 3 3 4 4 3 1 4 4 4 4 4 3 4 4 1 4 4 1 3 4 4 2
 4 4 2 3 4 3 1 1 3 1 4 3 1]
Related videos on Youtube
 05 : 53
 18 : 24
 04 : 13
 01 : 30
 06 : 57
 04 : 43
 04 : 40
 16 : 33
 01 : 28
PrestonDocks
My day job is as a software developer with BAE Systems. I work in Procurement in the Information Assurance team. I work with VBA, Python, ApEx and Crystal Reports. Out of office hours I develop web sites in PHP and Python. My frameworks of choice of Web2Py, Drupal and I have been known to do some work with Codeigniter. I work with small to medium size businesses creating and maintaining their retail web sites. My business model is to do all development work upfront for Free and then take a commission from sales through the WebSite. If you think we could work together please send me a message. Simon Carr Preston, Lancashire, UK
Updated on September 15, 2022Comments
-
PrestonDocks over 1 year
I have a csv file that shows parts on order. The columns include days late, qty and commodity.
I need to group the data by days late and commodity with a sum of the qty. However the days late needs to be grouped into ranges.
>56
>35 and <= 56
>14 and <= 35
>0 and <=14
I was hoping I could use a dict some how. Something like this
{'Red':'>56,'Amber':'>35 and <= 56','Yellow':'>14 and <= 35','White':'>0 and <=14'}I am looking for a result like this
        Red  Amber  Yellow  White
STRSUB  56   60     74      40
BOTDWG  20   67     87      34
I am new to pandas so I don't know if this is possible at all. Could anyone provide some advice.
Thanks
-
PrestonDocks almost 11 yearsThank you. I will look at this at work today and let you know how it went.
-
PrestonDocks almost 11 yearsCan you tell me how I can pivot these results. I think the groupby produces a series that can not be pivoted.
-
mtadd almost 11 yearsThe
groupbymethod generates aSerieswith aMultiIndex. You can useunstackto pivot the lowest level index into columns, as shown in the edited answer above. -
PrestonDocks almost 11 yearsThank you so much for this, I think this is going to help me achieve a lot with PANDAS in my day to day work. Thanks also to mtadd, I notice you have also updated your answer (it's appretiated).
-
PrestonDocks almost 11 yearsMany Thanks for your help.
-
 Tom N Tech over 5 yearsWhat if I want to group data into separate elements according to a decimal value? For instance, 1.0 with a decimal value of 0.2 would be split into 5 x 0.2 elements.