How to plot three sets of data in Excel?
It's not necessary, but it would make your life much easier if you rearrange your data. Here are your three sets of data arranged as XY pairs.
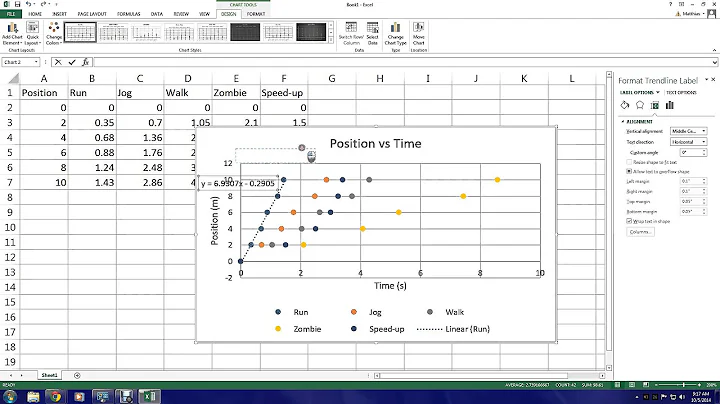
Select the first block of data and insert a chart.
Don't insert a line chart, you've discovered that this won't do what you want, without knowing exactly why. The reason why is that line charts don't treat X values as numerical values but as nonnumeric labels, and a line chart can only have one distinct set of X values.
Insert an XY Scatter chart, and use the subtype that has markers and lines. That's the chart at the bottom left of the screen shot.
Select the second set of data and copy it. Select the chart, and choose Paste Special from the Paste button dropdown on the Home tab. Choose these options: add new series, series in columns, categories (X values) in first column, series names in first row.
Repeat this copy/paste special action with the third set of data and you've got the chart at the bottom right of the screenshot.

Related videos on Youtube
 06 : 10
 01 : 57
 06 : 47
 03 : 44
 08 : 52
 07 : 21
snigdha
Updated on September 18, 2022Comments
-
snigdha over 1 year
I have 3 sets of data that show the specimen weight
W1 W2 W3

0   0   0
36  64  100
68  106 150
96  134 190
120 158 220
140 179 245
156 195 265
170 207 280
182 215 290
190 222 298
194 227 305
194 230 310
190 232 308
184 230 305
178 228 300
174 224 295
172 220 290
And I have 3 sets of data for the specimen diameter
D1      D2     D3

100     130    200
110     147.33 223.33
120.66  159.33 238
134     170.66 249.33
144     180.66 261.33
151.66  191.66 271.66
162     200    283.33
171.66  209    293.33
180.66  216.66 301.66
188.33  224    309.33
194.66  229.66 316.66
199.66  234.66 323.33
203.33  239.33 327.33
206.33  242.66 331.66
209.33  246    335
208     248.66 336.33
202.33  251.33 338.66
E.g. When W1 = 36 then D1 = 110
I can show W1, W2 & W3 on a line chart, but I cannot show the corresponding values for D1, D2 & D3 on the x axis. I can only show one of the columns either D1, D2 or D3. Can I link the columns of w1 & d1, w2 & d2 etc.
-
 fixer1234 over 8 yearsIs there a need to preserve the three catagories (does it convey some meaning)? A simple solution would be to reorganize the data into one long XY list (Dia, Wt).
 -
 Scott - Слава Україні over 8 yearsPlease describe the chart that you want.
 -
 Excellll over 8 yearspossible duplicate of Excel Chart X Axis Values
-