How to tune MySQL server when big peak of usage is expected
While a full analysis is a complex and difficult task, I can suggest a few areas from the information you have provided, and the warnings in the tuner.
1) You have 32GB RAM, but are only using 14GB for MySQL on a dedicated machine. Why not give it more? It's suggested 75% of RAM should be used by MySQL on a dedicated host (innodb_buffer_pool_size), but you should check top, vmstat or any long-term monitoring you have first to ensure there's headroom for other services, or occasional events like backups. Note Linux always looks like its "run out of RAM" because it dynamically uses any spare RAM for buffers and cache - as your example shows.
2) innodb_flush_method is a big performance factor, your setting is commented out, so I can't know the actual (default) value. Check the server variables to see what it is. But - changing it has great impact on your integrity in the event of an outage.
3) You have many fragmented tables. This can lead to performance loss - if they are highly fragmented. There are many other posts[1] which discuss finding how fragmented tables are, and whether defrag is required, but again it's a bit complex with different storage engines and table-per-file etc. To defragment them, you can use optimise, or alter to rebuild the table (of course these will lock tables, so you need to ensure it's quick by practising or arrange an outage).
1[How find and fix fragmented MySQL tables
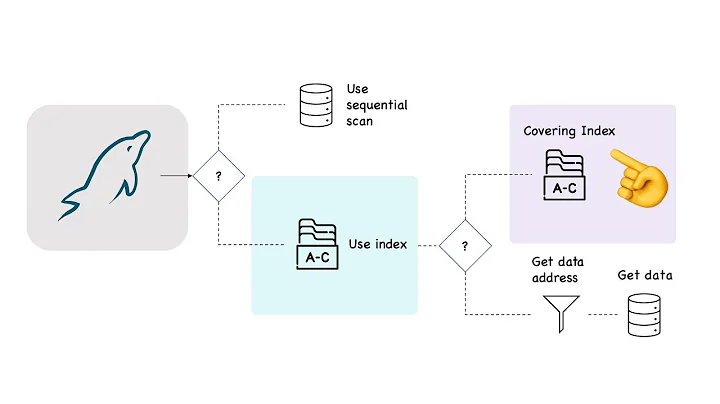
4) "Joins performed without indexes" - this could be your biggest problem although 131 doesn't sound very high.
Any query which doesn't/cannot use an index must check every record (table scan) which is slow for larger tables. If you haven't written the queries yourself (i.e. your using this Pretashop product) then you may not be able to work on this aspect.
However, to address this you need to find the queries, analyse them, then add indexes accordingly. To find the queries I'd start at the slow-query log: you don't have many slow-queries so I'd guess the slow threshold is set too high? So if you can lower that, then start picking off the slow queries and analysing them. Using the EXPLAIN command you should be able to see how the JOINS are missing indexes (although understanding EXPLAIN is another whole topic). Then adding indexes is straightforward but also has its pros and cons (e.g. inserts may run slower, too many indices can adversely affect performance), plus the indexing process will lock the table for a time.
There are also issues in the buffer metrics, but this is currently beyond my knowledge (this is what brought me to this question - I have the same write log efficiency problem which I don't understand yet).
Related videos on Youtube
 01 : 22 : 58
 17 : 19
 26 : 36
 19 : 18
 02 : 41
Julqas
I'm new in the StackExchange community. I hope I could help some people and continue to find answers to my questions ! BY DAY : Lead developer for a e-commerce company in France that mainly sells Swimwear and Sunwear, soon flip-flops ! BY NIGHT : I usually try to sleep at night, but when the sandman is missing, I like coding & programming, mostly in PHP. Aside from that, I'm trying to learn new things everyday and about various domains, from hacking to sysadmin things etc.. A little geeky in the spirit ! FOR FUN : I love coding new fun things with buddies, helping people, learn new languages etc..
Updated on September 18, 2022Comments
-
Julqas over 1 year
I'm having pretty big issues trying to tune my MySQL server. I was expecting a lot of people on my website after buying a tv ads between 5pm and 6pm, I have more or less 300 persons at the time on the website during this period. I tried a lot of tuning in my.cnf, but every night is worse and worse.. I would really appreciate some help to figure out what is my problem there.. My current infrastructure is the following :
One server for my website
- apache2 installed on it
- 6c / 12t - Intel(R) Xeon(R) CPU E5-1650 v2 @ 3.50GHz
- 64GB RAM - DDR3 ECC 1600 MHz
- Disk - HardRaid+ 3x480 Go SSD
One server for my DB
- Mysql 5.5.38 on it
- 4c / 8t - Intel(R) Xeon(R) CPU E5-1620 v2 @ 3.70GHz
- 32GB RAM - DDR3 ECC 1600 MHz
- Disk - SoftRaid 3x160 Go SSD
Here is my current configuration my.cnf :
innodb_file_per_table           = 1
innodb_buffer_pool_instances    = 13
innodb_buffer_pool_size         = 13375M
innodb_open_files               = 300
innodb_thread_concurrency       = 0
#innodb_read_io_threads          = 8
#innodb_write_io_threads         = 8
#innodb_flush_method             = O_DIRECT
#join_buffer_size                               = 30M
#sort_buffer_size                               = 10M
#read_buffer_size                               = 10M

wait_timeout                    = 180
interactive_timeout             = 180

max_connections                 = 250
max_heap_table_size             = 256M
tmp_table_size                  = 256M
table_cache                     = 20000
table_definition_cache          = 20000
#table_open_cache               = 20000
query_cache_type                = 0
And mysqltuner results :
 >>  MySQLTuner 1.6.9 - Major Hayden <[email protected]>
 >>  Bug reports, feature requests, and downloads at http://mysqltuner.com/
 >>  Run with '--help' for additional options and output filtering
[--] Performing tests on 127.0.0.1:3306
[OK] Logged in using credentials passed on the command line

[--] Skipped version check for MySQLTuner script
[OK] Currently running supported MySQL version 5.5.38-0+wheezy1-log
[OK] Operating on 64-bit architecture

-------- Storage Engine Statistics -----------------------------------------------------------------
[--] Status: +ARCHIVE +BLACKHOLE +CSV -FEDERATED +InnoDB +MEMORY +MRG_MYISAM +MyISAM +PERFORMANCE_SCHEMA
[--] Data in MyISAM tables: 32M (Tables: 126)
[--] Data in InnoDB tables: 10G (Tables: 1503)
[!!] Total fragmented tables: 359

-------- Performance Metrics -----------------------------------------------------------------------
[--] Up for: 1m 59s (82K q [695.832 qps], 335 conn, TX: 538M, RX: 34M)
[--] Reads / Writes: 99% / 1%
[--] Binary logging is disabled
[--] Total buffers: 13.8G global + 2.7M per thread (300 max threads)
[--] P_S Max memory usage: 0B
[--] Galera GCache Max memory usage: 0B
[OK] Maximum reached memory usage: 13.9G (44.07% of installed RAM)
[OK] Maximum possible memory usage: 14.6G (46.49% of installed RAM)
[OK] Slow queries: 0% (1/82K)
[OK] Highest usage of available connections: 3% (11/300)
[OK] Aborted connections: 0.60%  (2/335)
[OK] Query cache is disabled by default due to mutex contention.
[OK] Sorts requiring temporary tables: 0% (0 temp sorts / 14K sorts)
[!!] Joins performed without indexes: 131
[OK] Temporary tables created on disk: 5% (927 on disk / 17K total)
[OK] Thread cache hit rate: 96% (11 created / 335 connections)
[OK] Table cache hit rate: 25% (1K open / 6K opened)
[OK] Open file limit used: 0% (301/40K)
[OK] Table locks acquired immediately: 100% (221K immediate / 221K locks)

-------- ThreadPool Metrics ------------------------------------------------------------------------
[--] ThreadPool stat is disabled.

-------- Performance schema ------------------------------------------------------------------------
[--] Performance schema is disabled.
[--] Memory used by P_S: 0B

-------- MyISAM Metrics ----------------------------------------------------------------------------
[!!] Key buffer used: 18.2% (763K used / 4M cache)
[OK] Key buffer size / total MyISAM indexes: 4.0M/10.6M
[OK] Read Key buffer hit rate: 100.0% (562K cached / 0 reads)
[OK] Write Key buffer hit rate: 100.0% (14K cached / 0 writes)

-------- AriaDB Metrics ----------------------------------------------------------------------------
[--] AriaDB is disabled.

-------- InnoDB Metrics ----------------------------------------------------------------------------
[--] InnoDB is enabled.
[OK] InnoDB buffer pool / data size: 13.1G/10.7G
[OK] InnoDB buffer pool instances: 13
[!!] InnoDB Used buffer: 5.30% (45409 used/ 855985 total)
[OK] InnoDB Read buffer efficiency: 99.95% (85810161 hits/ 85850600 total)
[!!] InnoDB Write Log efficiency: 61.42% (519 hits/ 845 total)
[OK] InnoDB log waits: 0.00% (0 waits / 326 writes)

-------- TokuDB Metrics ----------------------------------------------------------------------------
[--] TokuDB is disabled.

-------- Galera Metrics ----------------------------------------------------------------------------
[--] Galera is disabled.

-------- Replication Metrics -----------------------------------------------------------------------
[--] Galera Synchronous replication: NO
[--] No replication slave(s) for this server.
[--] This is a standalone server.

-------- Recommendations ---------------------------------------------------------------------------
General recommendations:
    Run OPTIMIZE TABLE to defragment tables for better performance
    MySQL started within last 24 hours - recommendations may be inaccurate
    Adjust your join queries to always utilize indexes
Variables to adjust:
    join_buffer_size (> 128.0K, or always use indexes with joins)
CPU load is pretty low (between 1 and 4) when people are on the website since a few seconds. The worse is when lot of people are coming in the same time, the CPU load goes for 40 or 50, that's a problem and I don't understand which parameter I could adjut to avoid that.
RAM : I think the RAM is sufficient here. The server has 32GB that are not even used more when there is more people on the website. It stands at 15-20% and does not move during the day.. I don't understand why the RAM does not move, my proper goal would be to put the maximum of my queries in memory to avoid hitting disk.
During the peak times, here is the
free -m:total used free shared buffers cached Mem: 32202 25261 6940 0 917 18794 -/+ buffers/cache: 5549 26652 Swap: 1532 21 1511I'm using Prestashop for my website, and I have table that are pretty big..I'll archive and truncate a big part of it this weekend. For example :
SELECT COUNT(*) FROM ps_connections; => 1 330 373
SELECT COUNT(*) FROM ps_guest; => 6 970 248
If you have some advice it would be great ! Thanks Julien
NB : Sorry for my bad english
-
 EEAA about 8 years1) Collect performance data (CPU, RAM, Disk IO, iowait, etc.) 2) Analyze that data to identify bottlenecks. 3) Mitigate those bottlenecks. 4) Repeat until you're happy with performance.
 -
EEAA about 8 yearsThat said, it is very frequently the case that poor database performance problems are due to one of two things: 1) Lack of sufficient RAM in your system, requiring queries to hit disk 2) Improper index creation, causing full table scans on queries.
-
EEAA about 8 yearsConsider iowait. That's likely the problem, which will be addressed via additional RAM and tuning of indices.
-
Julqas about 8 yearsThanks @EEAA for your answer. I edited my initial question to add some informations. I will try to collect the missing data (Disk IO and iowait)
-
Julqas almost 8 yearsThanks @scipilot for your detailed answer. 1/ I will try to dedicate more RAM to MySQL, and tell you the results. I had a little idea about Linux using every RAM he found for buffers, cache etc.. Thanks for confirming my doubts. 2/ I will figure out the innodb_flush_method default value ASAP 3/ I will check with your links how to defrag the fragmented tables, thanks for it 4/ You're right 131 is far too much ! Prestashop is guilty there but I think using EXPLAIN I can create some index during night to increase the SELECT query speed. Slow query is set with 2 seconds!