Legend on bottom, two rows wrapped in ggplot2 in r
Solution 1
You were really close. Try this at the very end:
gg+guides(fill=guide_legend(nrow=2,byrow=TRUE))
Solution 2
The solution above is presented for a single aesthetic. In some cases, you may want to wrap the legend into rows instead of columns across different aesthetics. For posterity, this is shown below.
library(ggplot2)
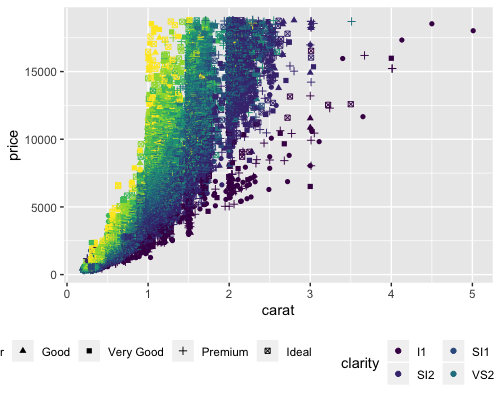
ggplot(diamonds, aes(x=carat, y=price, col=clarity, shape=cut)) +
geom_point() +
theme(legend.position="bottom")
The legend is cut off below:
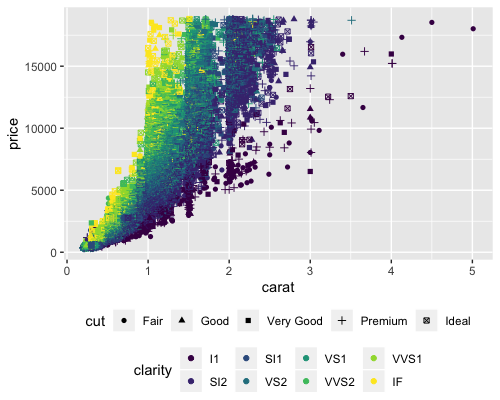
To wrap the legend using rows, we specify legend.box="vertical". Below, we also reduce the margin for compactness.
ggplot(diamonds, aes(x=carat, y=price, col=clarity, shape=cut)) +
  geom_point() +
  theme(legend.position="bottom", legend.box="vertical", legend.margin=margin())
Trevor Nederlof
Updated on July 03, 2021Comments
-
 Trevor Nederlof over 1 year
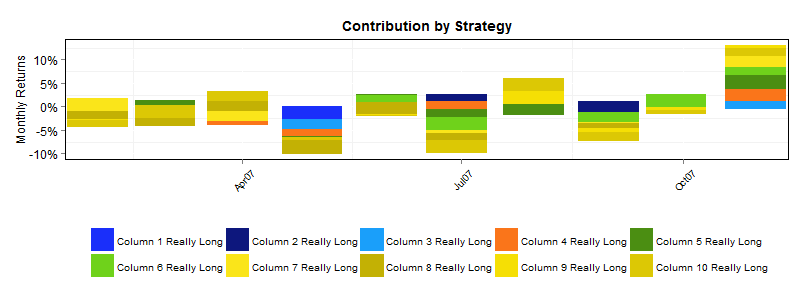
library(ggplot2)
library(scales)
library(reshape2)
Rdates <- c("2007-01-31","2007-02-28","2007-03-30","2007-04-30","2007-05-31","2007-06-29","2007-07-31","2007-08-31","2007-09-28","2007-10-31")
Rdates <- as.Date(Rdates)
Cnames <- c("Column 1 Really Long","Column 2 Really Long","Column 3 Really Long","Column 4 Really Long","Column 5 Really Long","Column 6 Really Long","Column 7 Really Long","Column 8 Really Long","Column 9 Really Long","Column 10 Really Long")
MAINDF <- data.frame(replicate(10,runif(10,-0.03,0.03)))
rownames(MAINDF) <- Rdates
colnames(MAINDF) <- Cnames
CUSTOMpalette <- c("#1a2ffa", "#0d177d", "#1a9ffa", "#fa751a", "#4b8e12", "#6fd21b", "#fae51a", "#c3b104", "#f5df05", "#dcc805")
MAINDF[,"dates"] <- Rdates
MAINDF <- melt(MAINDF,id.vars="dates")
gg <- ggplot(MAINDF, aes(x = dates, y = value, fill = variable))
gg <- gg + geom_bar(stat = "identity")
gg <- gg + scale_x_date(breaks = "3 months", labels=date_format("%b%y"),limits=c(min(as.Date(MAINDF$dates)),max(as.Date(MAINDF$dates))))
gg <- gg + theme(
  axis.text.x= element_text(color="black",angle=45, size=10, vjust=0.5),
  axis.text.y= element_text(color="black", size=12, vjust=0.5),
  axis.title.y = element_text(color="black",size=12, vjust=0.5),
  plot.title = element_text(color="black",face="bold",size=14, hjust=0.5,vjust=1),
  panel.background = element_blank(),
  panel.border = element_rect(linetype = "solid", colour = "black",fill=NA),
  legend.position="bottom",
  legend.title = element_blank(),
  legend.key = element_rect(fill="white"), legend.background = element_rect(fill=NA)
)
gg <- gg + xlab("") + ylab("Monthly Returns")
gg <- gg + ggtitle("Contribution by Strategy")
gg <- gg + scale_y_continuous(labels = percent_format())
gg <- gg + scale_fill_manual(values=CUSTOMpalette)
gg
Currently have a ggplot2 stacked bar graph setup. Everything works properly now except I am having an issue with the legend. I have put it on the bottom but there are 10 items so some are cutoff (doesnt fit). I tried
guides(fill=guide_legend(nrow=2))but this puts the labels in a different order (I want to get the first 5 across then the last 5 below. Any suggestions? -
Trevor Nederlof about 8 yearsAh wow cant believe I didnt find that. Thanks for the answer, was banging my head against the desk.
-
 mluerig almost 3 years
byrow=TRUEshould be the default behavior -
 Miao Cai over 2 yearsHi there, is there any way we can make the legend of clarity above that of cut? Thank you!
 -
 nstjhp about 2 years@MiaoCai Yes look at the order parameter of guide_legend e.g. stackoverflow.com/a/11397958/3275826