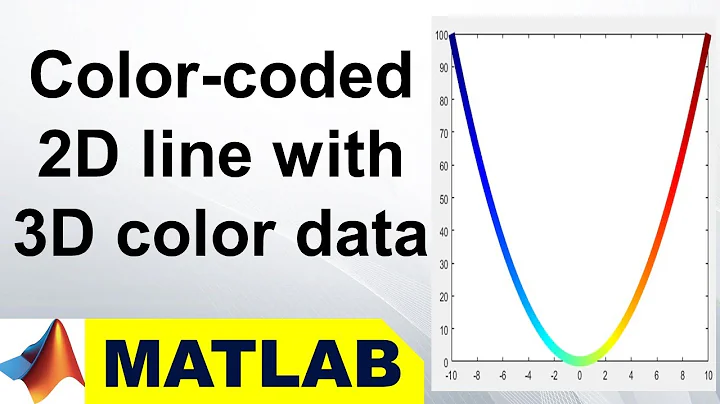
2-D line gradient color in Matlab
13,226
Solution 1
This is not difficult if you have MATLAB R2014b or newer.
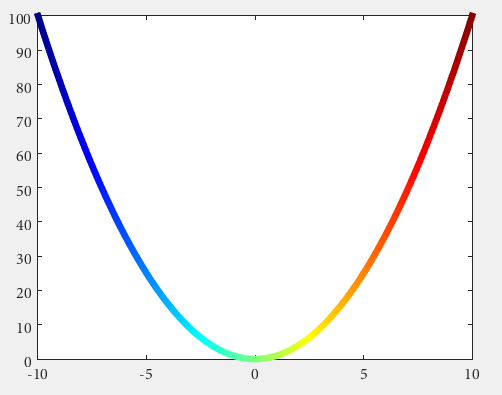
n = 100;
x = linspace(-10,10,n); y = x.^2;
p = plot(x,y,'r', 'LineWidth',5);
% modified jet-colormap
cd = [uint8(jet(n)*255) uint8(ones(n,1))].';
drawnow
set(p.Edge, 'ColorBinding','interpolated', 'ColorData',cd)
Which results in:
Excerpted from Undocumented Features - Color-coded 2D line plots with color data in third dimension. The original author was thewaywewalk. Attribution details can be found on the contributor page. The source is licenced under CC BY-SA 3.0 and may be found in the Documentation archive. Reference topic ID: 2383 and example ID: 7849.
Solution 2
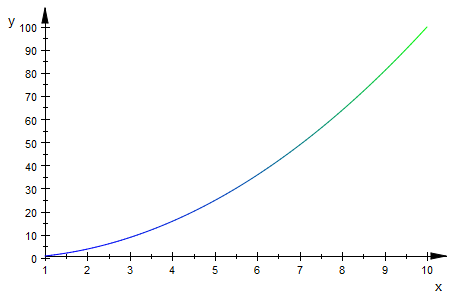
Here's one possible approach: explicitly plot each segment of the line with a different color taken from the desired colormap.
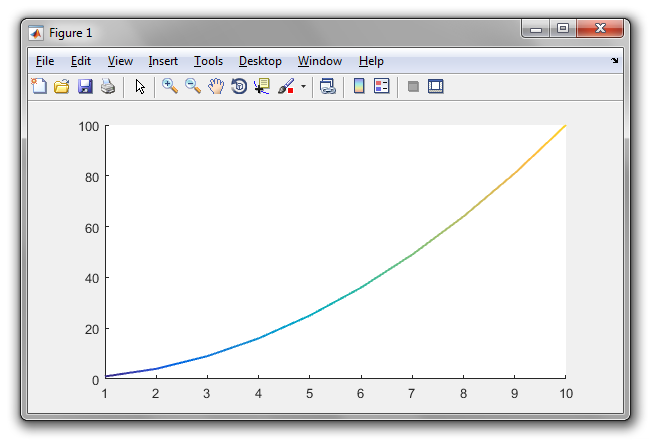
x = 1:10; % x data. Assumed to be increasing
y = x.^2; % y data
N = 100; % number of colors. Assumed to be greater than size of x
cmap = parula(N); % colormap, with N colors
linewidth = 1.5; % desired linewidth
xi = x(1)+linspace(0,1,N+1)*x(end); % interpolated x values
yi = interp1(x,y,xi); % interpolated y values
hold on
for n = 1:N
    plot(xi([n n+1]), yi([n n+1]), 'color', cmap(n,:), 'linewidth', linewidth);
end
Related videos on Youtube
14 : 15
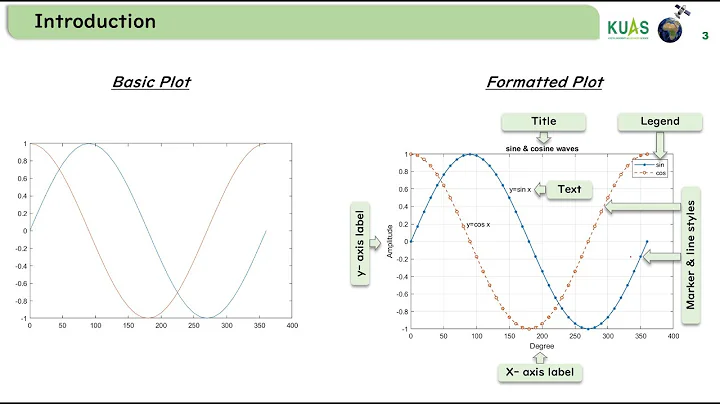
MATLAB for Engineers - Plot Formatting: Line Styles, Markers, Colors, and Legends
 20 : 45
MATLAB: 2D plot
 01 : 25
Color-Coded 2D Line with 3D Color Data | MATLAB
 05 : 36
Plotting in MATLAB-2D and 3D line plots
 27 : 50
Generating Professional Two-Dimensional Graphics in MATLAB
 05 : 05
Colormap Tutorial in Matlab
 51 : 26
6. MATLAB 2D plots (plot command and change line & color style)
 26 : 20
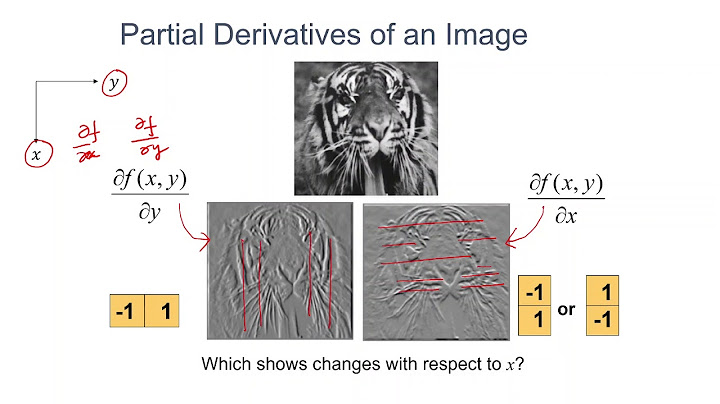
Lecture 04a Image Gradients
 05 : 08
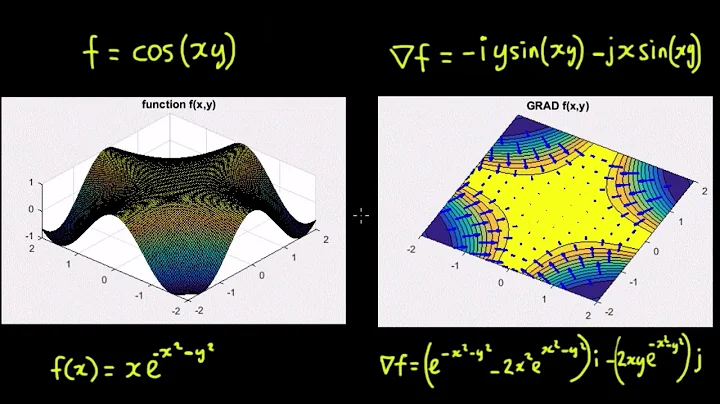
Matlab Gradient
Author by
Claude Monet
Updated on September 14, 2022Comments
-
 Claude Monet 9 months
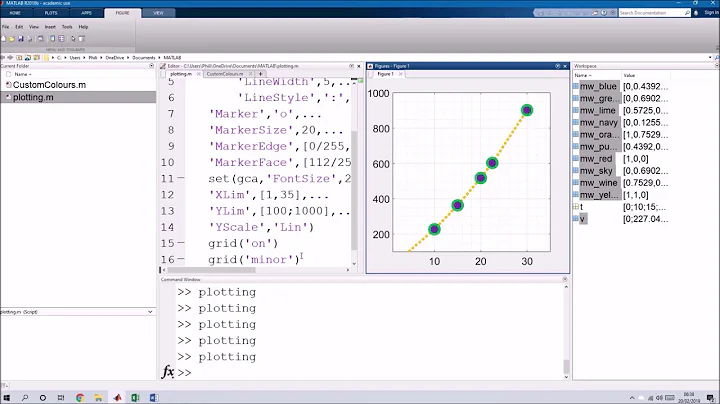
Is it possible to add gradient color to 2-D line in Matlab, especially when you have small number of data points (less than 10?), so the result would be similar to one in image below?