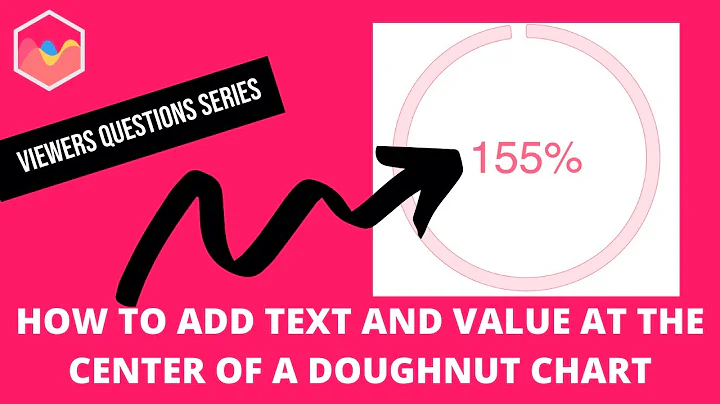
Add text inside the Doughnut chart of the React-Chartjs-2 box to react
Solution 1
I tried this and it worked
import { Doughnut } from "react-chartjs-2";

function DoughnutChart() {

 const data = {...}

 const options = {...}

 const plugins = [{
     beforeDraw: function(chart) {
      var width = chart.width,
          height = chart.height,
          ctx = chart.ctx;
          ctx.restore();
          var fontSize = (height / 160).toFixed(2);
          ctx.font = fontSize + "em sans-serif";
          ctx.textBaseline = "top";
          var text = "Foo-bar",
          textX = Math.round((width - ctx.measureText(text).width) / 2),
          textY = height / 2;
          ctx.fillText(text, textX, textY);
          ctx.save();
     }
   }]


  return (

        <Doughnut
          type="doughnut"
          data={data}
          options{options}
          plugins={plugins}
         />
  );
}

export default DoughnutChart;
Solution 2
From what I've seen from react-chartjs-2 it only has these properties:
data: (PropTypes.object | PropTypes.func).isRequired,
width: PropTypes.number,
height: PropTypes.number,
id: PropTypes.string,
legend: PropTypes.object,
options: PropTypes.object,
redraw: PropTypes.bool,
getDatasetAtEvent: PropTypes.func,
getElementAtEvent: PropTypes.func,
getElementsAtEvent: PropTypes.func
onElementsClick: PropTypes.func, // alias for getElementsAtEvent (backward compatibility)
Non of them seem to be text you can pass in to show your number in the middle. You can maybe use the legend prop and manipulate the object created for the legend to move it with css or have another div inside your render that displays the number and then style that to be inside the chart.
Another way you may be able to do it is by wrapping the Doughnut component in a div with another child inside that div that contains the text, like so:
    return(
    <div className='wrapper'>
        <div className='chart-number'>{this.state.text}</div>
        <Doughnut data={data} />
    </div>)
in your css then you will have to figure out how to position the chart-number div in the middle of the wrapper div, which will contain the chart.
If you are just starting to use this library, maybe look for a different one that suits your needs so you don't have to code around it!
Hope this helps :)
EDIT 1:
From what I see, you probably need to connect the Chart.pluginService.register code to your graph object somehow which is the <Doughnut /> component, then it will do the calculation before the redraw.
Solution 3
I don't believe React Chart JS has this option available. However, there are custom plugins out there that allow you to insert custom data labels inside of your doughnut charts. Please refer to this documentation on how to accomplish that.
Solution 4
Here is a simple solution:
Step 01: add this options in your options
options: {
        centerText: {
            display: true,
            text: `90%`
        }
      .....
      .....
Step 02: Create a new method drawInnerText
drawInnerText = (chart) => {

    var width = chart.chart.width,
        height = chart.chart.height,
        ctx = chart.chart.ctx;

    ctx.restore();
    var fontSize = (height / 114).toFixed(2);
    ctx.font = fontSize + "em sans-serif";
    ctx.textBaseline = "middle";

    var text = chart.config.options.centerText.text,
        textX = Math.round((width - ctx.measureText(text).width) / 2),
        textY = height / 2;

    ctx.fillText(text, textX, textY);
    ctx.save();
}
Step 03: Invoke drawInnerText
componentWillMount() {
        Chart.Chart.pluginService.register({
            beforeDraw: function (chart) {
                if (chart.config.options.centerText.display !== null &&
                    typeof chart.config.options.centerText.display !== 'undefined' &&
                    chart.config.options.centerText.display) {
                    this.drawInnerText(chart);
                }
            },
        });
    }
Related videos on Youtube
NelbeDG
Updated on May 28, 2022Comments
-
NelbeDG almost 2 years
I created a Donut chart, which works correctly but now I need to show the number 45 in the center of this, for example.
Where should I indicate the text to be displayed and the coordinates? In the options of the chart?
I'm using react component
class DoughnutChart extends React.Component {

  render() {
    const data = {
      datasets: [{
      data: [],
      backgroundColor: [
        '#999',
        '#eee'
      ]
    }],
     text: '45'
  };
    return (
       <Doughnut data={data} />
    );
  }
};

export default DoughnutChart;
EDIT
I found this plugin, but I cann't find how it applies to the react component
//Plugin for center text
Chart.pluginService.register({
  beforeDraw: function(chart) {
    var width = chart.chart.width,
    height = chart.chart.height,
    ctx = chart.chart.ctx;
    ctx.restore();
    var fontSize = (height / 160).toFixed(2);
    ctx.font = fontSize + "em sans-serif";
    ctx.textBaseline = "top";
    var text = "Foo-bar",
    textX = Math.round((width - ctx.measureText(text).width) / 2),
    textY = height / 2;
    ctx.fillText(text, textX, textY);
    ctx.save();
  }
});
Thanks for your help.
-
NelbeDG over 5 yearsThank you very much, but I have read about this library and I think it is not possible either. Because I need the value inside the chart.
-
NelbeDG over 5 yearsThanks for your answer, it can be useful. I found a plugin that can do this. I just edited my question, could You see it again please?
-
NelbeDG over 5 yearsI found a plugin that can do this. I just edited my question, could You see it again please?
-
 Kundan over 2 yearsI don't know why but your answer fixed text pixilation issue.


