AWS RDS instance 100% CPU utilisation for PostgreSQL for normal usage
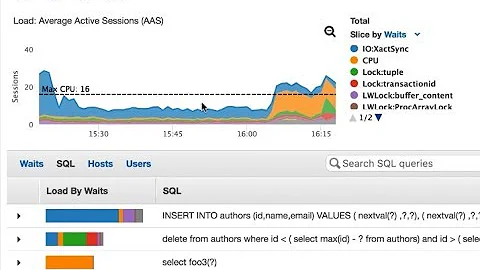
Once I had the issue with AWS RDS instance on which the CPU utilisation was 100% even after changing it to m3.xlarge from t2.medium. The issue figured out to be some queries which were getting stuck and keeps on running for hours keeping the CPU busy. The same query when fired through console gives the output in 4-5 seconds which was also too much. Although trying the same query from console gets executed successfully but sometimes it was getting stuck and kept on running for hours.
Following are the debugging methods I tried to reach to the root cause of the problem
Watch System Factors:
A comprehensive set of system performance metrics mainly for PostgreSQL are:
Disk Space : You must have 10% disk space available for the Postgres Data Partition as disk space may fluctuate during Postgres vaccum-ing when high write loads.
CPU Usage : High CPU usage will slowdown system performance as it also shows badly optimised queries which takes huge amount of CPU time. Bound CPU is the best situation for Postgres.
I/O Usage : If your Postgres runs slow,first measure the CPU percentage of IO wait that indicates the amount of time machine is waiting for the disk
**Watch Postgres Factors**
1. Total Number of Connections
max_connections determines the maximum number of concurrent transactions to a database server and give a list of clients which are leaking the database connections.
Command:
SELECT count(*) FROM pg_stat_activity;
2. Number of Connections by state
Four possible states of connections are :
(a) active - Connection currently executing the queries of transaction.
(b) idle - Connection not executing a transaction.
(c) idle in transaction - Connection in a long-running transaction i.i.e not executing query.
(d) idle in transaction(aborted) - Connection in a situation where transaction hasn't been rolled back due to an error.
Command:
SELECT state, count(*) FROM pg_stat_activity GROUP BY state;
3. Connections waiting for a lock
Blocked Connections waiting for a lock indicates slow execution of transaction with an exclusive lock.
Command:
SELECT count(distinct pid) FROM pg_locks WHERE granted = false
4. Maximum Transaction Age
Transactions should be as short as it will executed in less than a minute. Long-running transactions prevent Postgres from vaccum-ing old data, it may shutdown the database due to transaction ID(xid) wraparound. If this outputs more than one hour than this is a point of worry as the query is being running since that duration keeping the resources busy. Change the max age parameter (in application code) of the connection to lowest possible values like 2-3 seconds as per the average response time of your database query.
Command:
SELECT max(now() -xact_start) FROM pg_stat_activity WHERE state IN ('idle in transaction','active');
5.Checkpoint Interval
Frequent Checkpoints leads down performance.Postgres will display about those checkpoints in its log. Also, you can check the frequency in the pg_stat_bgwriter table.
6. Query Execution Time
You have to measure it at the application level.Or, by setting and analysing the log queries periodically log_min_duration_statement=0 or by monitoring the pg_stat_statements module
Related videos on Youtube
Admin
Updated on September 18, 2022Comments
-
 Admin over 1 year
am using aws rds Postgres 9.4. I am facing an issue of very high CPU utilization. Instance type is t2.xlarge (16 gb ram).
All the time I can see very low ram usage i.e. 14 gb free, 15 gb free.
But in comparison cpu utilization is 100%, with 100 active connection.
I have checked all my query in pg_stat_activity, slow query logs. Nothing found wrong. Though it touches 100% CPU utilization and my app becomes non functional even for very less active connections.
What is solution to reduce high CPU utilization against such high RAM?
When it reaches 100% CPU, my write IOPS was 400 count/second and read IOPS was 8.5 count/second.
I need to handle 300 concurrent connections some times when very high traffic on my website. What should be idle configuration of rds instance?
-
 Tim over 5 yearsSuggest you post on the DBA forum. I expect it's something to do with intensive queries or indexing, rather than being RDS specific. No doubt there are features of PostgreSQL that will help you work out where the CPU is being used.
 -
Brad Parks over 2 yearsa good document from amazon on How can I troubleshoot and resolve high CPU utilization on my DocumentDB instances?
-


