calculated column in pivot table from power pivot
You've almost got the solution - but you don't need to create a second pivot table.
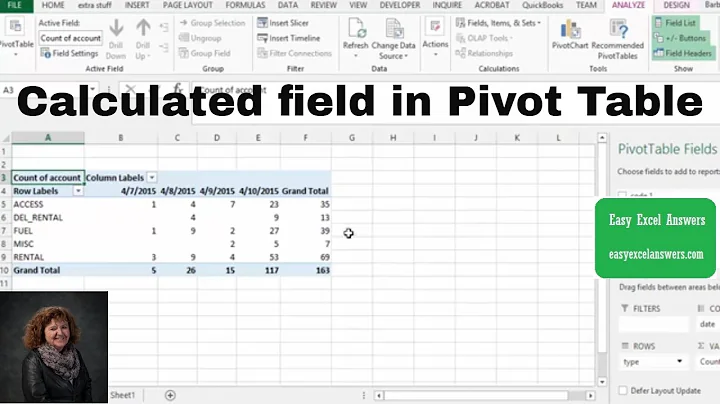
Let's start from here - you've got your pivot table as described above, and now you're looking to add a Difference column.

Drag Total into the Values area a second time. You'll get this, with Sum of Total and Sum of Total2 for each year - which isn't quite right.

In the Values section, swap Tax Year and ∑ Values so that ∑ Values is on top.

Now, as you worked out, right-click on your second column, and select Show Values As > Difference From and then select Tax year and previous.

Related videos on Youtube
 11 : 47
 02 : 24
 03 : 11
 08 : 12
 13 : 02
Yasskier
Updated on September 18, 2022Comments
-
Yasskier over 1 year
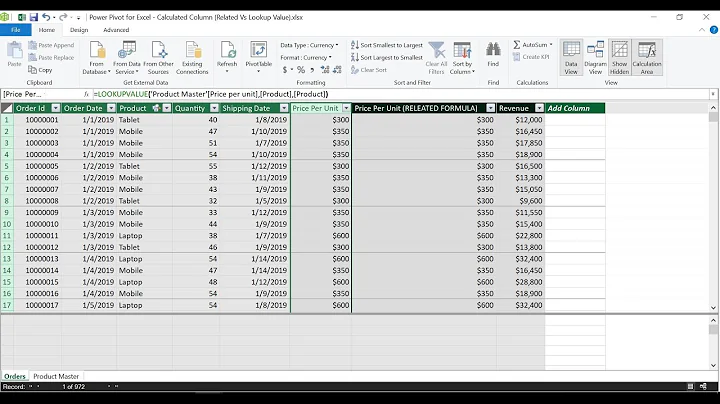
From SQL server I have a query that gives me daily transaction numbers for few companies per day, something like
DATE          Company    Total    Tax year
2013-04-24    ABC         50       2013
2013-10-15    DEF         20       2014
And so on. This data goes nicely into power pivot and then to pivot table so I can show values per company per month/year
            2013      2014
ABC
January     600       750
Feb         800       900

DEF
January     1000      750
Feb         900       110
Now, the simples thing I need is to add the DIFFERENCE column. But since the data is taken from the database, Excel treats it as an OLAP data and the option "Calculated field" in "Fields, items and sets" is greyed out. I don't want simply paste the data from the database (which would be the easiest solution) since it would be nice to have this data live. Its such a trivial thing, yet I can't get with reasonable solution.
OK, I've found PARTIAL solution by creating additional pivot table and by displaying the difference based per year (instead of sums). This can be done by clicking on the new pivot chart, selecting "Show values as > Difference from and then selecting "Tax year" and "previous"