ChartJS Line Charts - remove color underneath lines
Solution 1
Check this section on the Chart.js docs. Set the fill property to false within your dataset configuration:
var data = {
    labels: ["January", "February", "March", "April", "May", "June", "July"],
    datasets: [{
        label: "My First dataset",
        fill: false,
        data: [1, 2, 3]
    }]
};
Specify an array to the borderColor property if you want each line to have a different stroke color:
var myColors = ['red', 'green', 'blue']; // Define your colors

var data = {
    labels: ["January", "February", "March", "April", "May", "June", "July"],
    datasets: [{
        label: "My First dataset",
        fill: false,
        borderColor: myColors
        data: [1, 2, 3]
    }]
};
Solution 2
Below solution was working when integrated chart js with Angular
$scope.options = {
                    scales: {
                      yAxes: [
                        {
                          id: 'y-axis-1',
                          type: 'linear',
                          display: true,
                          position: 'left'
                        }
                      ]
                    },
                    elements: {
                        line: {
                                fill: false
                        }
                    }
                };

<canvas id="" class="col-sm-12 chart chart-line" chart-data="data"
                            chart-options="options" chart-colors="colors">
</canvas>
Solution 3
Just set the fill option to be false in the datasets options:
data: {
   datasets: [{
      label: "",
      data: dataPoints,
      borderColor: color ,
      fill:false //this for not fill the color underneath the line
                                }]
                            },
Solution 4
This worked for me:
$scope.color = [{
                  backgroundColor: 'transparent',
                  borderColor: '#F78511',
                },];
Solution 5
I solved this issue.
First step. html element inner add <- chart-colors="colors" like this :
<canvas id="line" class="chart chart-line" data="data" labels="labels" chart-colors="colors" legend="true" series="series" options="options" click="onClick"></canvas>
second step. $scope val colors Add like this :
$scope.colors = [{
        backgroundColor : '#0062ff',
        pointBackgroundColor: '#0062ff',
        pointHoverBackgroundColor: '#0062ff',
        borderColor: '#0062ff',
        pointBorderColor: '#0062ff',
        pointHoverBorderColor: '#0062ff',
        fill: false /* this option hide background-color */
    }, '#00ADF9', '#FDB45C', '#46BFBD'];
good luck!
Related videos on Youtube
 13 : 05
 11 : 09
 04 : 46
 28 : 56
 19 : 52
 22 : 44
 06 : 37
 09 : 43
 01 : 29
 05 : 29
 24 : 06
 01 : 40
Manus Gallagher
Updated on July 08, 2022Comments
-
Manus Gallagher almost 2 years
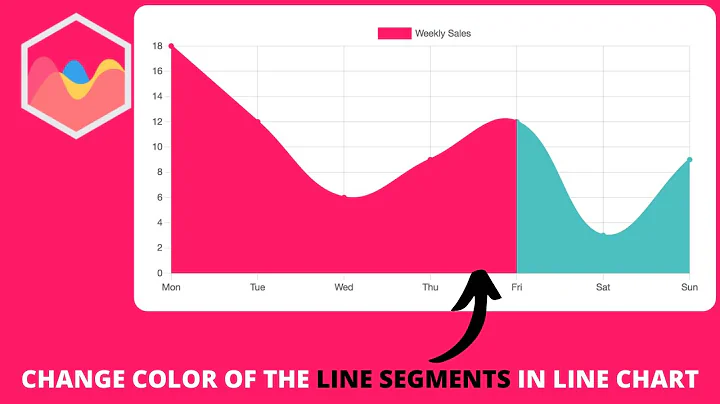
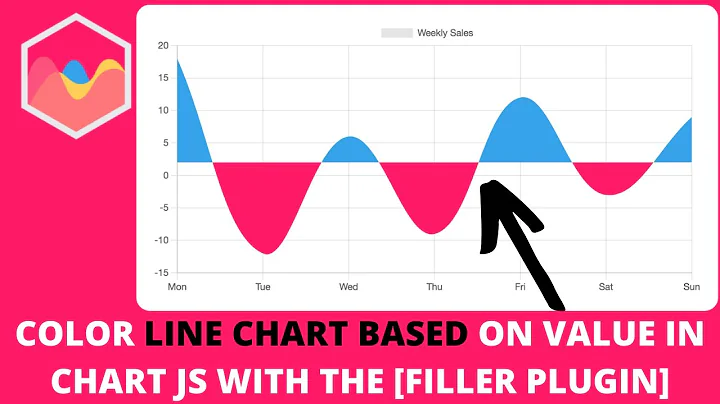
Okay, so I have a ChartJS line chart working that populates directly from data coming for my db. What I need now is to get rid of the color underneath each of the lines. [as seen in the screenshot below].

Here's my HTML:
<div ng-if="hasData">
    <canvas id="line" class="chart chart-line" data="data" labels="labels" legend="true" series="series" options="options" click="onClick"></canvas>
<div>
Here's My JS:
            scope.labels = ['02:00','04:00','06:00', '08:00', '10:00', '12:00','14:00', '16:00', '18:00', '20:00', '22:00'];
            scope.series = series;
            scope.data = [volumesSelectedDate, volumesPeakDate, volumesModelCapacity];


            scope.options = {
                scaleOverride: true,
                scaleStartValue: 0,
                scaleSteps: 11,
                scaleStepWidth: 6910,
            }

            scope.loadingDailyAppVolumes = false;
            scope.hasData = true;


        };
        scope.onClick = function (points, evt) {
            //console.log(points, evt);
        };
So, how would I go about this? Also, how would I go about manually setting the color for each line?
Example:
selected date: blue, peak date: yellow, model capacity: grey.
Thanks.
-
Manus Gallagher almost 8 yearsOkay, but my setup for each chart is different. I don't have a dataset config.
-
 Linus Borg almost 8 years...and what is this different setup? Do you use some angular plugin for chart.js? Did you create a custom code?
 -
 JasonK almost 8 years@LinusBorg I wonder too. Couldn't find anything in the docs about that particular setup.
 -
Zach P almost 8 yearsI am a contributor to Chart.js and the code in the question is not from the core library.