Correlation clustering in R
Solution 1
I admittedly know very little about this subject, but just to point you in a direction:
- Have you looked at the cluster package? It has very good documentation. In particular, look at help(agnes) for some suggestions. Martin Maechler (a member of the R core team) created the package and has contributed to Stack Overflow discussions before, so hopefully he'll provide an answer here.
- The hclust() function is part of the stats package. In fact, I believe that there are plans to merge hclust() and agnes().
- You may also find this page from the Bioconductor project helpful.
- Otherwise, you may have some luck looking at other packages on the CRAN Clustering, Natural Language Processing or Machine Learning views.
Solution 2
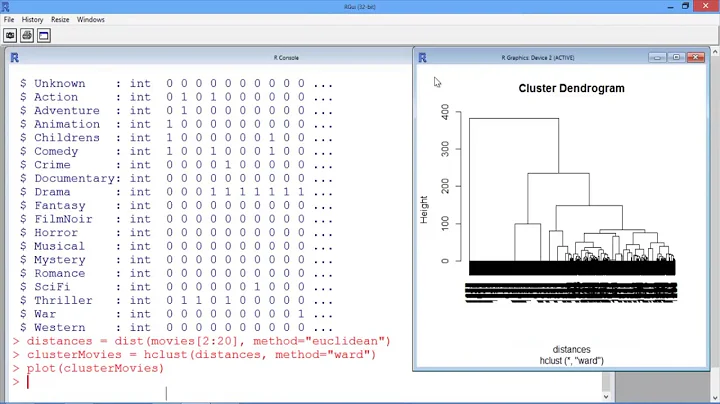
The standard approach would be one that involves cor(), hclust() and plot.hclust().
I'd highly recommend heatmap.2 from the wonderful gplots package.
Solution 3
It's easy to use the agnes function in the cluster package with a dissimilarity matrix. Just set the "diss" argument to TRUE.
If you can easily compute the dissimilarity matrix outside R, then that may be the way to go. Otherwise, you can just use the cor function in R to generate the similarity matrix (from which you can get the dissimilarity matrix by subtracting from 1).
Solution 4
I went to http://www.rseek.org/ and entered agnes algorithm and found the CLUSTER package on CRAN has the following function details for function AGNES.
Details
agnes is fully described in chapter 5 of Kaufman and Rousseeuw (1990). Compared to other agglomerative clustering methods such as hclust, agnes has the following features: (a) it yields the agglomerative coefficient (see agnes.object) which measures the amount of clustering structure found; and (b) apart from the usual tree it also provides the banner, a novel graphical display (see plot.agnes).
The agnes-algorithm constructs a hierarchy of clusterings. At first, each observation is a small cluster by itself. Clusters are merged until only one large cluster remains which contains all the observations. At each stage the two nearest clusters are combined to form one larger cluster.
For method="average", the distance between two clusters is the average of the dissimilarities between the points in one cluster and the points in the other cluster. In method="single", we use the smallest dissimilarity between a point in the first cluster and a point in the second cluster (nearest neighbor method). When method="complete", we use the largest dissimilarity between a point in the first cluster and a point in the second cluster (furthest neighbor method).
Clustering is a pretty huge topic and you'll find many packages for R that implement some form of it. When you have both attributes and covariates, combining clustering with ordination can sometimes yield more insight.
Related videos on Youtube
 06 : 36
 08 : 55
 09 : 35
 16 : 54
 11 : 04
 08 : 38
 06 : 34
 10 : 54
 13 : 07
daveb
Updated on April 16, 2022Comments
-
daveb about 2 years
I'd like to use
correlation clusteringand I figureRis a good place to start.I can present the data to
Ras a set of large, sparse vectors or as a table with a pre-computed dissimilarity matrix.My questions are:
- are there existing
Rfunctions to turn this into ahierarchical clusterwithagnesthat usescorrelation clustering? - will I have to implement the (admittedly simple)
correlation clusteringfunction by hand, if so how do I make it play well withagnes?
- are there existing
-
Shane over 14 yearsNo problem. Feel free to post any follow up back into this question when you figure everything out! :)