CPU and profiling not supported for remote jvisualvm session
Solution 1
Remote profiling of code and allocation isn't supported by Visual VM. This sucks, however if you want to enable the CPU graph you can do this by enabling JMX with
-Dcom.sun.management.jmxremote=true
-Dcom.sun.management.jmxremote.port=12345
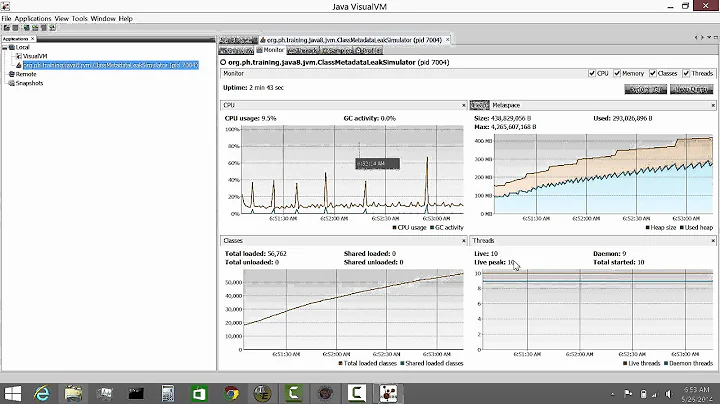
You may need to add some authentication settings too based on your network. The JMX settings will give you the CPU usage, and thread state, as well as doing a remote jstack.
A list of features for the remote version can be found here: Visual VM features
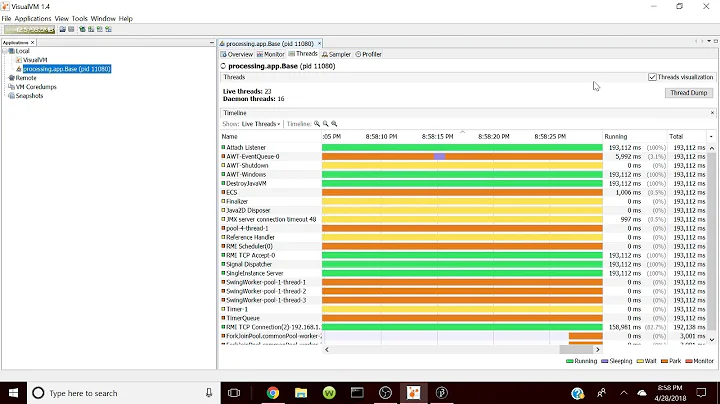
EDIT Get the latest version of visual vm 1.2.1 and download the VisaulVM-Sampler. This will read from a JMX connection to show the profiling information.
Solution 2
Connecting the eclipse java program.
Step 1: ensure your Eclipse -> Preferences -> Java -> Installed JREs is pointing to the same jdk where you have started the visualvm.
Step 2: Ensure Right click -> Run configuration has the following
-Dcom.sun.management.jmxremote=true -Dcom.sun.management.jmxremote.authenticate=false -Dcom.sun.management.jmxremote.ssl=false -Dcom.sun.management.jmxremote.port=16001
Step 3: Importantly follow the below suggestion.
https://visualvm.java.net/troubleshooting.html#jpswin2
Description: An error dialog saying that local applications cannot be monitored is shown immediately after VisualVM startup. Locally running Java applications are displayed as (pid ###).
Resolution: This can happen on Windows systems if the username contains capitalized letters. In this case, username is UserName but the jvmstat directory created by JDK is %TMP%\hsperfdata_username. To workaround the problem, exit all Java applications, delete the %TMP%\hsperfdata_username directory and create new %TMP%\hsperfdata_UserName directory.
Also try JVMMonitor is decent plugin for eclipse stand alone program monitoring.
Solution 3
Is it because the remote version is (albeit slightly) greater than the local version?
Related videos on Youtube
 08 : 27
 08 : 42
 08 : 14
 13 : 04
 07 : 50
 06 : 00
 08 : 25
 10 : 21
 03 : 43
 04 : 42
 33 : 21
yawn
Updated on April 17, 2022Comments
-
yawn about 2 years
When monitoring a remote app (using jstatd) I can neither profile nor monitor CPU consumption. Heap monitoring (provided I do not use G1) works. jvisualvm provides the message "Not supported for this JVM." in the CPU graph window.
Is there anything missing in my setup? Google showed very few results.
The local environment (Mac OS X 10.6):
java version "1.6.0_15"
Java(TM) SE Runtime Environment (build 1.6.0_15-b03-219)
Java HotSpot(TM) 64-Bit Server VM (build 14.1-b02-90, mixed mode)
The remote environment (Linux version 2.6.16.27-0.9-smp (gcc version 4.1.0 (SUSE Linux))):
java version "1.6.0_16" Java(TM) SE
Runtime Environment (build
1.6.0_16-b01) Java HotSpot(TM) 64-Bit Server VM (build 14.2-b01, mixed mode)
Local monitoring works as advertised.
-
yawn over 14 yearsWorks! +1 for the visualvm 1.2.1 and plugin suggestion & accepted.
-
yawn over 14 yearsFollowup: JMX in 1.6 has security enabled by default. For development one might want to disable security, see java.sun.com/j2se/1.5.0/docs/guide/management/…
-
Yar almost 10 years"Remote profiling of code and allocation isn't supported by Visual VM" - is this still true as of jvisualvm 1.3.8?
-
Benj over 8 yearsAdding
-Dcom.sun.management.jmxremote.portwas sufficient for me (IntelliJ + JBoss). My VM Options for full monitoring are :-XX:+UnlockCommercialFeatures -XX:+FlightRecorder -Dcom.sun.management.jmxremote=true -
 debiasej over 5 yearsI don't exactly why but I also have to add
-Djava.rmi.server.hostname=localhost