d3 axis labeling
Solution 1
Axis labels aren't built-in to D3's axis component, but you can add labels yourself simply by adding an SVG text element. A good example of this is my recreation of Gapminder’s animated bubble chart, The Wealth & Health of Nations. The x-axis label looks like this:
svg.append("text")
    .attr("class", "x label")
    .attr("text-anchor", "end")
    .attr("x", width)
    .attr("y", height - 6)
    .text("income per capita, inflation-adjusted (dollars)");
And the y-axis label like this:
svg.append("text")
    .attr("class", "y label")
    .attr("text-anchor", "end")
    .attr("y", 6)
    .attr("dy", ".75em")
    .attr("transform", "rotate(-90)")
    .text("life expectancy (years)");
You can also use a stylesheet to style these labels as you like, either together (.label) or individually (.x.label, .y.label).
Solution 2
In the new D3js version (version 3 onwards), when you create a chart axis via d3.svg.axis() function you have access to two methods called tickValues and tickFormat which are built-in inside the function so that you can specifies which values you need the ticks for and in what format you want the text to appear:
var formatAxis = d3.format("  0");
var axis = d3.svg.axis()
        .scale(xScale)
        .tickFormat(formatAxis)
        .ticks(3)
        .tickValues([100, 200, 300]) //specify an array here for values
        .orient("bottom");
Solution 3
If you want the y-axis label in the middle of the y-axis like I did:
- Rotate text 90 degrees with text-anchor middle
- Translate the text by its midpoint
- x position: to prevent overlap of y-axis tick labels (
-50) - y position: to match the midpoint of the y-axis (
chartHeight / 2)
- x position: to prevent overlap of y-axis tick labels (
Code sample:
var axisLabelX = -50;
var axisLabelY = chartHeight / 2;

chartArea
    .append('g')
    .attr('transform', 'translate(' + axisLabelX + ', ' + axisLabelY + ')')
    .append('text')
    .attr('text-anchor', 'middle')
    .attr('transform', 'rotate(-90)')
    .text('Y Axis Label')
    ;
This prevents rotating the whole coordinate system as mentioned by lubar above.
Solution 4
If you work in d3.v4, as suggested, you can use this instance offering everything you need.
You might just want to replace the X-axis data by your "days" but remember to parse string values correctly and not apply concatenate.
parseTime might as well do the trick for days scaling with a date format ?
d3.json("data.json", function(error, data) {
if (error) throw error;
data.forEach(function(d) {
d.year = parseTime(d.year);
d.value = +d.value;
});
x.domain(d3.extent(data, function(d) { return d.year; }));
y.domain([d3.min(data, function(d) { return d.value; }) / 1.005, d3.max(data, function(d) { return d.value; }) * 1.005]);
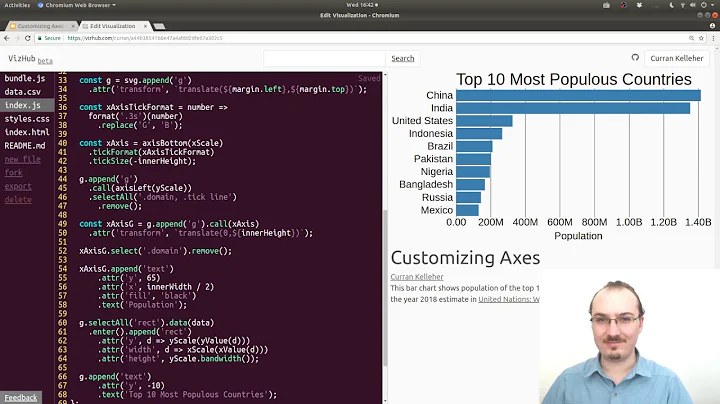
g.append("g")
.attr("class", "axis axis--x")
.attr("transform", "translate(0," + height + ")")
.call(d3.axisBottom(x));
g.append("g")
.attr("class", "axis axis--y")
.call(d3.axisLeft(y).ticks(6).tickFormat(function(d) { return parseInt(d / 1000) + "k"; }))
.append("text")
.attr("class", "axis-title")
.attr("transform", "rotate(-90)")
.attr("y", 6)
.attr("dy", ".71em")
.style("text-anchor", "end")
.attr("fill", "#5D6971")
.text("Population)");
Solution 5
D3 provides a pretty low-level set of components that you can use to assemble charts. You are given the building blocks, an axis component, data join, selection and SVG. It's your job to put them together to form a chart!
If you want a conventional chart, i.e. a pair of axes, axis labels, a chart title and a plot area, why not have a look at d3fc? it is an open source set of more high-level D3 components. It includes a cartesian chart component that might be what you need:
var chart = fc.chartSvgCartesian(
    d3.scaleLinear(),
    d3.scaleLinear()
  )
  .xLabel('Value')
  .yLabel('Sine / Cosine')
  .chartLabel('Sine and Cosine')
  .yDomain(yExtent(data))
  .xDomain(xExtent(data))
  .plotArea(multi);

// render
d3.select('#sine')
  .datum(data)
  .call(chart);
You can see a more complete example here: https://d3fc.io/examples/simple/index.html
Related videos on Youtube
 04 : 40
 17 : 51
 26 : 05
 36 : 01
 01 : 11
 01 : 30
user1474218
Updated on July 24, 2022Comments
-
user1474218 almost 2 years
How do I add text labels to axes in d3?
For instance, I have a simple line graph with an x and y axis.
On my x-axis, I have ticks from 1 to 10. I want the word "days" to appear underneath it so people know the x axis is counting days.
Similarly, on the y-axis, I have the numbers 1-10 as ticks, and I want the words "sandwiches eaten" to appear sideways.
Is there a simple way to do this?
-
lubar almost 11 yearsI've found that
.attr("transform", "rotate(-90)")causes the whole co-ordintate system to rotate. Thus, if you're positioning with "x" and "y", you need to swap the positions from what I expected. -
ted.strauss almost 11 yearsany special consideration for the case of multiple charts and wanting axis labels on all of them?
-
Michael Scheper almost 9 yearsNice explanation, but it seems the OP already has ticks on their axes.
-
 ambodi almost 9 yearsOP? I don't get the abbreviation, sorry.
 -
Michael Scheper almost 9 yearsNo worries. OP = 'Original Post' or 'Original Poster'. (Search engines and urbandictionary.com is a pretty good references for abbreviations like this.)
-
Michael Clark almost 9 yearsSure, I've added some more detail, is that better?
-
Michael Scheper almost 9 yearsYep! I already upvoted it, because your original answer put me on the right track, but the way it is now, future readers won't have to fiddle with it as much to work out what it all means. :-) Cheers.
-
Hartley Brody about 3 yearsAfter reading so many tutorials that position axis labels explicitly by doing math on x and y values... I finally noticed the text-anchor SVG attribute your answer mentions, which helped make the label stick to the ends of the axis without needing to know the label's own width/height to calculate an offset.