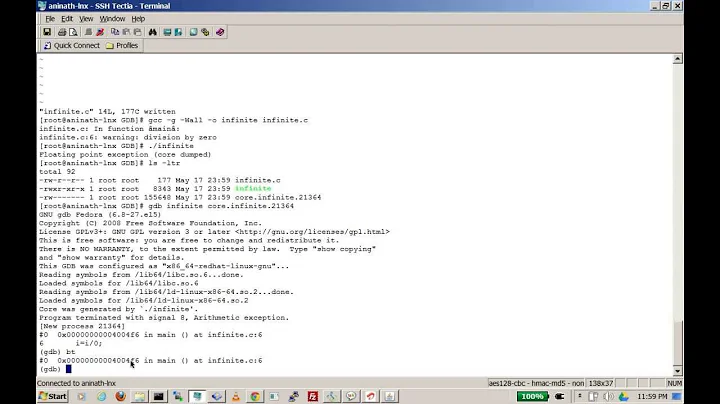
Debugging in Linux using core dumps
Solution 1
It sounds like there are other differences between your release and debug build then simply the absence/presence of the -g flag. Assuming that's the case, there is nothing you can do right now, but you can adjust your build to handle this better:
Here's what we do at my place of work.
- Include the
-gflag when building the release version. - Archive that version.
- run
strip --strip-unneededon the binary before shipping it to customers.
Now, when we get a crash we can use the archived version with symbols to do debugging.
One thing to note is that if your release version includes optimization, debugging may be difficult even with symbols. For example, the optimizer can reorder your code so even though the debugger will say you crashed on line N, you can't assume that the code actually executed line N-1.
Solution 2
You need to do some additional stuff to create binaries with stripped debug information that you can then debug from cores. Best description I could find is here
Solution 3
No, you don't miss anything. debug and release are just different binaries, so the core files of release don't match the debug binary. You have to look at machine code to get something from the release core dump.
You probably have to ask your user how the crash happened and collect additional log information or whatever you app produces.
Related videos on Youtube
themoondothshine
The human consciousness is a substance beyond the confines of our bodies. Mind over matter. Believe it.
Updated on April 15, 2022Comments
-
themoondothshine about 2 years
What are the 'best practices' when it comes to debugging core dumps using GDB?
Currently, I am facing a problem:
- The release version of my application is compiled without the '-g' compiler flag.
- The debug version of my application (compiled with '-g') is archived (along with the source code, and a copy of the release binary).
Recently, when a user gave me a core dump, I tried debugging it using
gdb --core=./core.pid ./my_app_debug-binThe core was created by
my_app_release-bin. There seems to be some kind of mismatch between the core file and the binary.On the other hand, if I try
gdb --core=./core.pid ./my_app_release-binthe core matches but I am unable to get source code line numbers (although I get the function names).
Is this what is practised? Because I feel I am missing something here.
-
Idan K over 14 yearsNice extra tagging in the question title, I mean it's not like SO has built-in tagging...
-
themoondothshine over 14 yearsHey Michael, Thanks for the link. It was really helpful.
-
themoondothshine over 14 yearsHey Samuel, This is the right way to go, I think. Even @Michael pointed to a similar solution. However, the debug/release binaries only have the difference of -g. There's also the macros _DEBUG (for debug) and NDEBUG (for release). Maybe that is causing the issue? Anyway, I plan to explore stripped binaries a little more. Thanks!
-
themoondothshine over 14 yearsHey nodan, I already log quite a lot of information in the application, but sometimes it may not be quite enough. Users most often don't know what caused the crash because it runs as a background process. I also have some more information on a 'addr2line' tool. I think I'll give that one a try too.
-
themoondothshine over 14 yearsBTW, do you know anything about an 'addr2line' tool? I found obscure references to it. It is supposed to be able to convert addresses to line numbers given the source code. I already have the function addresses, all I need is a mapping to source code...
-
Hasturkun over 14 years@themoondothshine: GDB can do this for you (so long as it has debug symbols), use
info line *0xsomeaddr -
themoondothshine over 14 yearsThanks @Hasturkun. The addr2line is actually used to convert the output of the 'backtrace' system call. Anyway, I tried most of the techniques in the answers here, and this is working out best:<br/> -- Compile using "-g" flag<br/> -- Copy debug symbols using 'objcopy --only-keep-debug MyApp-bin MyApp-bin.debug'<br/> -- Strip debug symbols using 'strip -g MyApp-bin'<br/> -- Add a debug link using 'objcopy --add-gnu-debuglink=MyApp-bin.debug MyApp-bin'<br/>
-
R Samuel Klatchko over 14 years@themoondoshine - if _DEBUG or NDEBUG have different values between your release and debug version that can make the difference (if you have any conditional compilation based on those flags, either direct or indirect though something like
assert, then changing them will affect the binary).


