debugging spiking netstat "failed connection attempts" with iptables
Solution 1
To determine where the connections are coming from.... Here is an example to log SSH traffic. The format will look like this in your kernels log
MONTH DAY TIME SERVERNAME kernel: [IPTABLES] : IN=eth0 OUT= MAC=00:00:00:00:00:00:00:00:00:00:00:00:00:00 SRC=REMOTEIP DST=SERVERIP LEN=00 TOS=0x00 PREC=0x00 TTL=# ID=# DF PROTO=TCP SPT=# DPT=22 WINDOW=# RES=0x00 SYN URGP=0 OPT (#)
Here we create a new chain called MyLOG
# iptables -N MyLOG
Flush the new chain just in case
# iptables -F MyLOG
create the logging feature on tcp port 22 set the logs to alert and an easy to see "[IPTABLES]" string to the beginning of the log line.
# iptables -A MyLOG -i eth0 -p tcp --dport 22 -j LOG --log-level alert --log-tcp-options --log-ip-options --log-prefix '[IPTABLES] : '
attach MyLOG chain to input chain
# iptables -A INPUT -i eth0 -j MyLOG
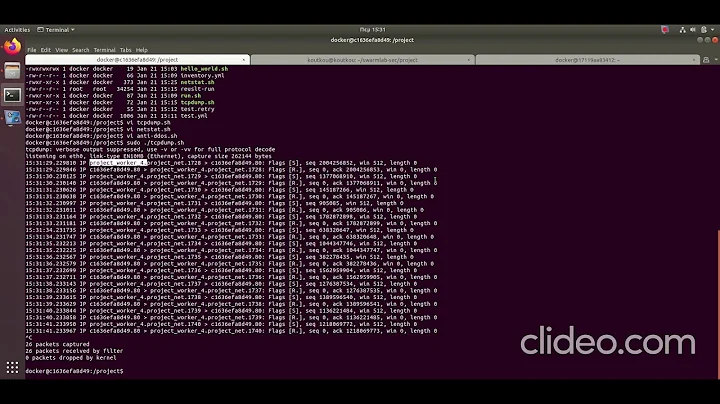
This should send the logs to your kernel log (though some flavors of linux may vary the results). You can test the logging by tailing your kernel log.
# tail -f /var/log/kern.log
If you are at the console and notice the tons of data splattering across your screen you can try setting the console log output with
dmesg -n 1
If you want to get "statistics" you can run
# iptables -nvxL
the output will show the amount of packets and bytes sent from the time the chain was created.
Chain MyLOG (1 references)
    pkts      bytes target     prot opt in     out     source               destination
      61     4416 LOG        tcp  --  eth0   *       0.0.0.0/0            0.0.0.0/0
I have a script here http://www.hilands.com/code-shell-fw.html which I used to log certain port activity, and collected data for serverstats serverstats (downloadable from berlios), setup NAT'ing, port-forwarding, attempts to break port scans, and uses tcp-rejects instead of drops.
Serverstats can be difficult to figure out. Its a set of PHP scripts that uses RRDTool. It uses a shell script to trigger the iptables output. My garbled notes tell me you need to modify the configuration array with something like this to get it to run
'ssh-traffic' => array(
        'used' => true,
        'chains' => array('MyLOG'),
        'graphs' => array(
            'combined_bps' => array('used' => true, 'title' => 'Combined (bps)'),
            'single_bps' => array('used' => true, 'title' => '%s (bps)'),
            'combined_count' => array('used' => true, 'title' => 'Combined (count)'),
            'single_count' => array('used' => true, 'title' => '%s (count)')
        )
    ),
Solution 2
Thanks for the replies guys.
My goal here is to understand why the spikes in the graph are regular and cyclical, and then make them stop. These are coming in at a slow trickle (5 or so at a time). I understand that tcp connections fail for one reason or another, but there is obviously something afoot because of their regularity. I suspect a cron job somewhere, a load balancer misconfiguration, or a monitoring device as the culprit.
I've decided to take the UTSL approach, and here's where I'm at so far:
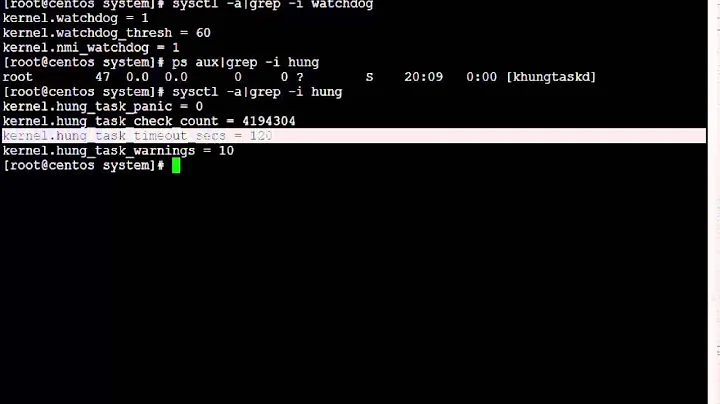
netstat -s gets it's statistics from /proc/net/snmp.
Great. So the kernel updates an SNMP counter every time there is a failed connection attempt.
What id like to accomplish, is every time there is a failed connection, to not only updates this counter, but to also log "failed connection attempt from IP $foo at $timestamp"
So... what qualifies as a failed connection attempt?
downloads kernel source greps around concludes that the counter I'm looking for is TCP_MIB_ATTEMPTFAILS
grepping through the 2.6.18 source tree, I've found two places where this is referenced:
./net/ipv4/tcp_minisocks.c:
453 struct sock *tcp_check_req(struct sock *sk,struct sk_buff *skb,
454                            struct request_sock *req,
455                            struct request_sock **prev)
456 {

592                 if (flg & (TCP_FLAG_RST|TCP_FLAG_SYN)) {
593                         TCP_INC_STATS_BH(TCP_MIB_ATTEMPTFAILS);
594                         goto embryonic_reset;
595                 }

640 }
... and, include/net/tcp.h
915 static inline void tcp_done(struct sock *sk)
916 {
917         if(sk->sk_state == TCP_SYN_SENT || sk->sk_state == TCP_SYN_RECV)
918                 TCP_INC_STATS_BH(TCP_MIB_ATTEMPTFAILS);
919
920         tcp_set_state(sk, TCP_CLOSE);
921         tcp_clear_xmit_timers(sk);
922
923         sk->sk_shutdown = SHUTDOWN_MASK;
924
925         if (!sock_flag(sk, SOCK_DEAD))
926                 sk->sk_state_change(sk);
927         else
928                 inet_csk_destroy_sock(sk);
929 }
I'm a bit surprised that these are the only two conditions that generate a counter update, but whatever.
The first block seems pretty obvious. "If you see a TCP packet with both the RST and SYN flags set, update the TCP_MIB_ATTEMPTFAILS counter and reset the connection".
In an attempt to catch these, I put in the following iptables rules
iptables -A INPUT -p tcp -m tcp --tcp-flags SYN,RST SYN,RST -j LOG
iptables -A OUTPUT -p tcp -m tcp --tcp-flags SYN,RST SYN,RST -j LOG
waits ….. nothing. =(
The second block is a little more mysterious, but I'm going to guess and assume that this means "update the TCP_MIB_ATTEMPTFAILS counter if the socket is in a certain state when tearing it down"
This, I have no idea how to test for this.
My questions are now: 1) Am I misinterpreting this graph somehow? 2) Am I on the right track? 3) Short of writing a kernel module (which I'm no where near skilled enough to do), how can I accomplish my logging goal?
Thanks
-s
Related videos on Youtube
 03 : 00
 26 : 07
 04 : 22
 54 : 45
 10 : 17
user1918834
Updated on September 17, 2022Comments
-
user1918834 over 1 year
In this query:
select * from ( select distinct a.id as 'Id Documento', b.valor, 'index'+cast(row_number() over(partition by a.id order by b.idIndice) as varchar(10)) rn from tgpwebged.dbo.sistema_Documentos as a join tgpwebged.dbo.sistema_Indexacao as b on a.id = b.idDocumento join tgpwebged.dbo.sistema_DocType as c on a.idDocType = c.id join tgpwebged.dbo.sistema_DocType_Index as d on c.id = d.docTypeId where d.docTypeId = 40 and (b.idIndice = 11 AND b.valor = '11111111' OR b.idIndice = 12 AND b.valor = '11111') ) src pivot ( max(valor) for rn in (Index1, Index2) ) piv- How to add the value of b.idIndice in the 2 pivoted columns?
I have this:
id Documento Index1 Index2I need
id Documento 11 12Second. I am getting
Id Documento    Index1     Index2
13          11111111   11111111
14          11111111   11111111
16          11111      11111
It is mixing the values... the value '11111111' should be on Index1 column and '11111' should be on Index2 columns.
What can I do?