Does any golang interactive debugger exist?
Solution 1
Update: Personally, while GDB works I'm not a fan of using it in Go and it will make you spit some blood. Check out some of the other answers for good alternatives.
Yes, of course :)
Go has a debugger (GDB)
Here is the official tutorial on how to use it.
If you'd like 'graphical debugging' (that is, setting breakpoints in the editor) some IDEs let you do that (with GDB in the background).
In specific, Eclipse, LiteIDE and Zeus all let you set breakpoints and debug from your coding environment (source). Here is a video on how to do it with Zeus.
Solution 2
GDB support for go has lots of issues that won't be fixed by the go team.
For more information, read the post by Rob Pike:
Although we will endeavor to keep basic gdb functionality (stack traces, printing values) working on supported platforms, the ability to use the debugger to understand a Go program's full environment will likely never work, and improving gdb support is not a priority for the team.
They are looking for other debugging options but have no concrete plans by now.
The documentation is outdated and the runtime-gdb.pyscript coming with go 1.2
does not work for a GDB that was compiled with python3 support (current Ubuntu for example).
Solution 3
Update 2017: the godebug project mentions below is now official replaced by derekparker/delve.
Original answer:
You now (March 2015) have another approach, based on instrumenting the code.
godebuguses source code generation to instrument your program with debugging calls.
go tool covertakes a similar approach to code coverage.
- When you run
godebug, it parses your program, instruments function calls, variable declarations, and statement lines, and outputs the resulting code somewhere (currently either stdout or in place over your original files).- When you run this modified code, assuming you put a breakpoint somewhere, you can step through it and inspect variables.
Coming later: evaluate arbitrary Go expressions and write to variables.
Update June 2015:
While it might not be as interactive as "some" might hope, it is still appreciated (and has "step into" feature).
See "Go has a debugger—and it's awesome!" (Cloudfare)
here's the cool bit: instead of wrestling with half a dozen different
ptraceinterfaces that would not be portable,godebugrewrites your source code and injects function calls likegodebug.Lineon every line,godebug.Declareat every variable declaration, andgodebug.SetTracefor breakpoints (i.e. wherever you type_ = "breakpoint").I find this solution brilliant.
What you get out of it is a (possibly cross-compiled) debug-enabled binary that you can drop on a staging server just like you would with a regular binary.When a breakpoint is reached, the program will stop inline and wait for you on stdin.
It's the single-binary, zero-dependencies philosophy of Go that we love applied to debugging. Builds everywhere, runs everywhere, with no need for tools or permissions on the server.
ifdef GODEBUG
    GOPATH="${PWD}" go install github.com/mailgun/godebug
    GOPATH="${PWD}" ./bin/godebug build -instrument "${GODEBUG}" -o bin/rrdns rrdns
Debugging is just a
make bin/rrdns GODEBUG=rrdns/...away.
Solution 4
UPDATE:
I have checked it out and am happy to report that Version: 2016.1.3, Build: 145.1617.8, Released: June 5, 2016 works with Delve! You can download it here: https://www.jetbrains.com/idea/download/. Also follow the Delve install instructions here: https://github.com/derekparker/delve/tree/master/Documentation/installation
It's a bit flaky. Just after I got the OSX login prompt the interactive debugging started working. Sometimes, I have to debug a simple .go program to kick start it. But it does work and is the best interactive debugging experience for Go that I've seen.
ORIGINAL POST:
Does any golang interactive debugger exist? Yes.
Does any golang interactive debugger, that is worth using, exist? No.
Configuring GDB on the mac is tedious, but doable.
However, once you start using it you'll soon realize that you just wasted your time installing it.
You can even configure IntelliJ to use it.
The only value that IntelliJ, LiteIDE, CGDB, etc. seem to provide is that you can more quickly ascertain that GDB debugging support for Go is extremely poor.
You can use it to step through some Go code, but try to print the value of anything other than very simple variable values and you'll be wasting your time wishing for a decent debugger.
Here's an example of what happens when you try to print the value of a map[string]string data structure using CGDB:
(gdb) print params
$1 = (github.com/go-martini/martini.Params) 0x15582 <runtime.reentersyscall+450>
...which is completely useless.
Next, try this:
(gdb) print params["UserID"]
...and you'll get "Bus error".
Delve (https://github.com/derekparker/delve) looks promising, since it is written in Go, but you drive it using the console, not via an IDE.
I would gladly pay for the enterprise version of IntelliJ (or any other IDE) that did a decent job supporting interactive debugging in Go.
As of now, fmt.Printf("%v", variable) is about as good as it gets.
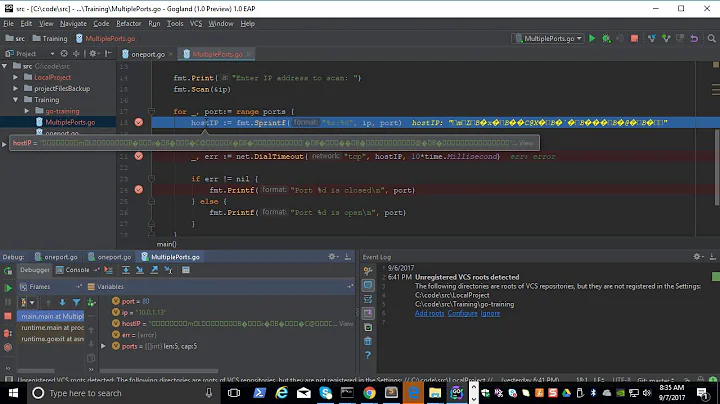
Solution 5
EDIT
The GO debugger is now a simple plugin in IntelliJ or PyCharm, no need to install anything else. Just look for the Go plugin in the plugin preferences.
Original answer (Nov 2015)
for those looking for the latest as of end of Nov 2015:
get delve
https://github.com/derekparker/delve
and follow the build / setup instructions:
https://github.com/derekparker/delve/wiki/Building
Get the latest IntelliJ (15) or PyCharm (5)
https://www.jetbrains.com/idea/download/
and get the go-lang-plugin in the IDE of your choice:
Pycharm -> Preference -> plugins -> search for go
current version is Version: 0.10.749
IntelliJ -> Preference -> plugins -> search for go
current version is Version: 0.10.749
- Setup a new Go project, or Import a project.
- Setup you Go SDK as prompted
- Setup your Go library (usually in GOROOT/src
- Setup a Run Application configuration top right corner by the 'play' icon:
- Edit Configurations -> click + -> Go Application
Define you package or file to run.
Once done with the setup, the Play icon and Debug icon should now be active, and you can set breakpoint, watches etc... as usual.
Cheers
Related videos on Youtube
![VScode for Golang - How to setup Visual Studio Code for Go [2020]](https://i.ytimg.com/vi/TfCMweSHWHw/hq720.jpg?sqp=-oaymwEXCNAFEJQDSFryq4qpAwkIARUAAIhCGAE=&rs=AOn4CLBUoq0JkcniZ74Ko6WOdnl5dtrBWQ) 11 : 56
11 : 56
 08 : 17
 08 : 53
 03 : 38
 14 : 06
 01 : 55 : 43
 03 : 47
 08 : 22
 22 : 42
 11 : 42
 04 : 31
Daniel Williams
Working software professional specializing in highly scalable applications. You can reach me at enknamel AT gmail DOT com SOreadytohelp
Updated on July 08, 2022Comments
-
Daniel Williams almost 2 years
The title pretty much sums it up. I am trying out Go and I really miss being able to set breakpoints and step in/over/out as much as I want within an interactive environment. I know I can use gdb to debug Go but that is quite annoying compared to using an IDE that can plug into gdb for breakpointing.
I tried searching for one and could only find plugins or small IDEs that have syntax highlighting but no debugging.
-
Leigh over 7 yearsTo anyone else who lands on this question, make sure you check out the other answers, not just the (currently accepted) one about GDB
-
-
Daniel Williams almost 11 yearsAs a follow up I am on a mac and I've found the IntelliJ go plugin to make development very nice and easy but the LiteIDE is really great at debugging (though not perfect it works very well). I did have to install an updated GDB to make it work at all which was kind of painful.
-
metakeule almost 10 yearsIt has lots of issues and will not be supported by the go team in the future (apart from basic functionality), see my answer below
-
Valerio almost 10 yearsthat's not reassuring for a language that is starting being adopted now
-
metakeule almost 10 years@ValerioColtrè I never needed a debugger in go. unit tests and Printf("%#v", ...) served me well so far...
-
gotgenes over 9 years@metakeule Nobody needs a debugger, however, a good debugger can prove incredibly helpful and more efficient in debugging - especially in debugging failing tests. Plus, debuggers do not alter your code, while print statements do.
-
masukomi over 9 yearsFrom the GDB docs: "GDB does not understand Go programs well. The stack management, threading, and runtime contain aspects that differ enough from the execution model GDB expects that they can confuse the debugger, even when the program is compiled with gccgo. As a consequence, although GDB can be useful in some situations, it is not a reliable debugger for Go programs, particularly heavily concurrent ones"
-
Ivan Chau almost 9 yearsHow does Go work with debuggers? "We’ve talked for a while about a custom Go debugger, but there isn’t one yet." by Russ Cox
-
Michele Giuseppe Fadda over 8 yearsNot anymore! outdated answer.
-
l3x over 8 yearsmailgun/godebug is a vast improvement; It is worth using. However, what would be very much worth using is an IDE that had an integrated, interactive debugger. Debugging from the console is reminiscent of debugging in the 80's. Adding instrumentation to my Go code works, but is a bit intrusive. I'd rather just (un)click on a row of code to (un)set a breakpoint.
-
Michele Giuseppe Fadda over 8 yearsI will restate... dvelve debugger + intelliJ idea IDE.!
-
Michele Giuseppe Fadda over 8 yearsGDB on go broke ages ago and is no longer functional. Accepted answer is outright WRONG.
-
Benjamin Gruenbaum over 8 years@user4839438 uhh, the first two lines are literally "don't use gdb on go". I personally used
godebugwhich was pretty nice last time I go'd. -
Michele Giuseppe Fadda over 8 yearsYou are right, but the title says "Go has a debugger (gdb)", which actually isn't true anymore and is currently a disservice. GDB used to work with old versions of golang, trying to make it work was a big pita, and in the end, it did not work and can't possibly work. I'm an happy puppy with Dwelve, I'll try godebug as well.
-
Benjamin Gruenbaum over 8 yearsFeel free to post an answer - this answer literally starts with "Personally, while GDB works I'm not a fan of using it in Go and it will make you spit some blood. Check out some of the other answers for good alternatives." :)
-
l3x over 8 yearsHey user4839438, I just noticed your post. Will try it out. If that works, it would certainly be worth paying any JetBrains upgrade fees. And not that it matters to me, but I did hear that the Delve debugger supposedly works in MS Visual Studio. See marketplace.visualstudio.com/items/lukehoban.Go
-
MrE over 8 yearsCan you explain how you set it up with IntelliJ? The debugger must run as an HTTP endpoint, doesn't it?
-
MrE over 8 yearsnevermind... found the docs etc... but apparently requires the latest version of PyCharm or IntelliJ to work out of the box.
-
Michele Giuseppe Fadda over 8 yearsI did nothing special, I just installed Dvelve and intelliJ 14, It still works correctly with IntelliJ 15. About previous versions: I don't know.
-
 Stefan Wuthrich - Altafino over 8 yearsevaluate/watch dont work for me: could not find symbol value for... Could you resolve this for you ?
 -
MrE over 8 yearswatch and evaluate seem to work fine for me, in PyCharm 5.0.3 CE as well as IntelliJ IDEA 15.0.2
-
dlsniper over 8 yearsYou actually don't need to build delve, the plugin comes with it bundled automatically.
-
MrE over 8 years@dlsniper is this recent? When I tried, i had had the go plugin install for a while, i upgraded but it didn't work until I built delve.
-
dlsniper over 8 years@MrE delve has been shipped with the plugin since it was integrated, which is about 3 months ago. But it works only on Linux & Mac OS X both 64bit.
-
l3x almost 8 yearsI have checked it out and am happy to report that Version: 2016.1.3, Build: 145.1617.8, Released: June 5, 2016 works with Delve! You can download it here: jetbrains.com/idea/download. Also follow the Delve install instructions here: github.com/derekparker/delve/tree/master/Documentation/…
-
Ostati over 7 yearsDelve is lagging behind though but still better than others IMO.
-
Daniel Williams about 7 yearsVery nice! LiteIDE has been a bit ... too light. I love IntelliJ and will check this out.
-
gideon over 6 yearsThis IMO is the best answer. Option #3 it's also a multi platform solution. Delve has some limitations but basic visual debugging works rather well.
-
 Alexandro de Oliveira over 6 yearsGodebug is now deprecated and they recommend to use Delve instead
 -
 VonC over 6 years@AlexandrodeOliveira Thank you. I have updated the answer accordingly.
 -
 Edwin O. over 6 yearsthat is a very UGLY thing how Rob Pike puts it
 -
Gerry Gleason over 5 yearsTrying out delve, seems to work pretty well. Seems to me this answer of a decent open source tool makes the question less "off topic". I get not wanting to rate closed tools. Maybe the question needs to be refrased, but I got hear searching for alternatives to gdb after finding it (gdb) isn't really recommended for go.
-
 Vipin Mohan over 2 yearsanyone heard of or used delve? github.com/go-delve/delve