Draw polygons more efficiently with matplotlib
29,390
Solution 1
You could consider creating Collections of polygons instead of individual polygons.
The relevant docs can be found here: http://matplotlib.org/api/collections_api.html With a example worth picking appart here: http://matplotlib.org/examples/api/collections_demo.html
As an example:
import numpy as np
import matplotlib.pyplot as plt
from matplotlib.collections import PolyCollection
import matplotlib as mpl

# Generate data. In this case, we'll make a bunch of center-points and generate
# verticies by subtracting random offsets from those center-points
numpoly, numverts = 100, 4
centers = 100 * (np.random.random((numpoly,2)) - 0.5)
offsets = 10 * (np.random.random((numverts,numpoly,2)) - 0.5)
verts = centers + offsets
verts = np.swapaxes(verts, 0, 1)

# In your case, "verts" might be something like:
# verts = zip(zip(lon1, lat1), zip(lon2, lat2), ...)
# If "data" in your case is a numpy array, there are cleaner ways to reorder
# things to suit.

# Color scalar...
# If you have rgb values in your "colorval" array, you could just pass them
# in as "facecolors=colorval" when you create the PolyCollection
z = np.random.random(numpoly) * 500

fig, ax = plt.subplots()

# Make the collection and add it to the plot.
coll = PolyCollection(verts, array=z, cmap=mpl.cm.jet, edgecolors='none')
ax.add_collection(coll)
ax.autoscale_view()

# Add a colorbar for the PolyCollection
fig.colorbar(coll, ax=ax)
plt.show()

HTH,
Solution 2
I adjusted my code and now it is working flawlessly :)
Here is the working example:
lons = np.array([data['lon1'],data['lon3'],data['lon4'],data['lon2']])
lats = np.array([data['lat1'],data['lat3'],data['lat4'],data['lat2']])
x,y = m(lons,lats)
pols = zip(x,y)
pols = np.swapaxes(pols,0,2)
pols = np.swapaxes(pols,1,2)
coll = PolyCollection(pols,facecolor=colorval,cmap=jet,edgecolor='none',zorder=2)
plt.gca().add_collection(coll)
Related videos on Youtube
 00 : 36
Python code Drawing polygon
 20 : 27
11 Let's draw polygons by programming a function in Python | Cool patterns | Cool designs
 14 : 33
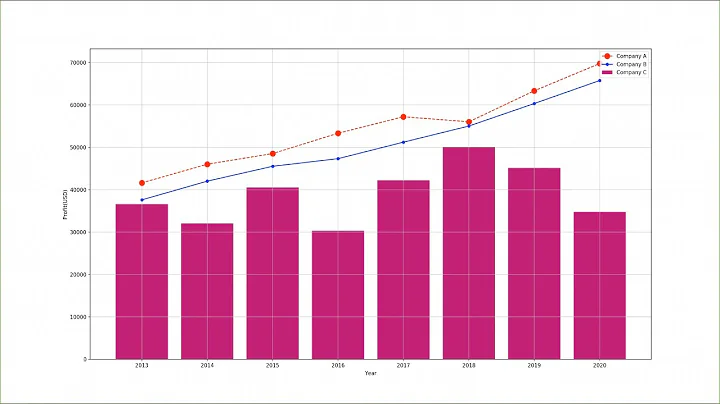
01-Vẽ đồ thị multiline sử dụng Matplotlib, python 3, có nhiều tuỳ chỉnh
 05 : 28
Drawing Shapes With matplotlib
 04 : 17
Add shapes to matplotlib figures with matplotlib patches || Matplotlib Tips
 13 : 30
How to create a point/line/polygon shapefile with Python and Fiona - Tutorial
 04 : 28
Python tutorial 2019 #14 DRAW POLYGONS CHALLENGE
 12 : 34
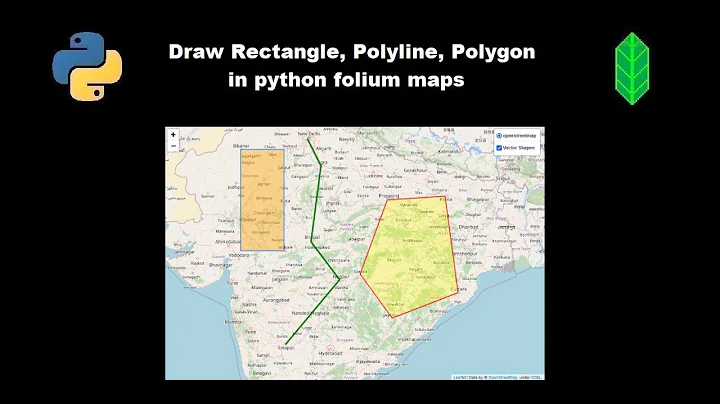
Draw Rectangle, Polyline, Polygon in python folium maps
 13 : 48
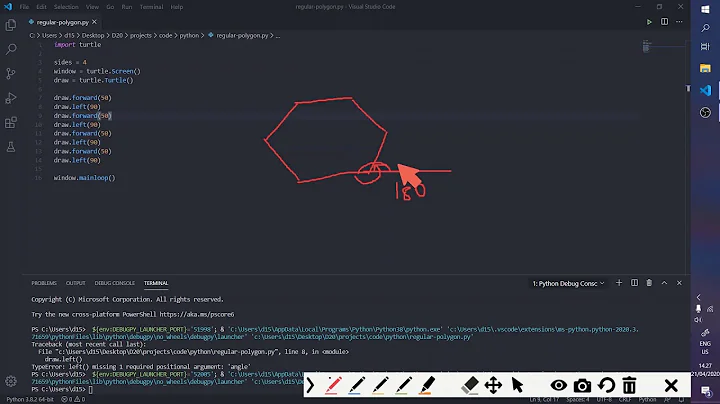
Drawing any regular polygon in Python
Author by
HyperCube
Updated on May 13, 2020Comments
-
HyperCube almost 4 years
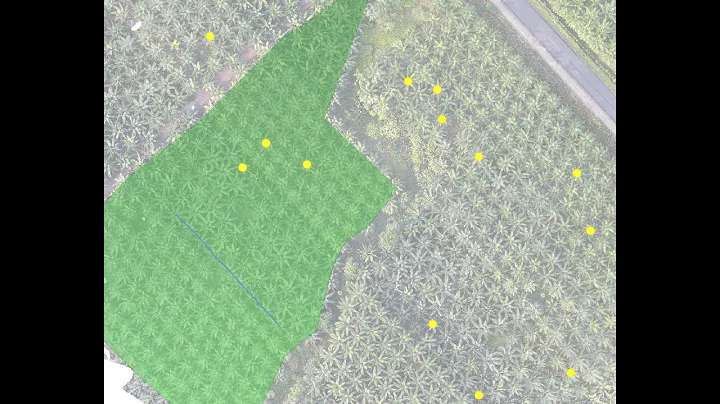
I have a dateset of around 60000 shapes (with lat/lon coordinates of each corner) which I want to draw on a map using matplotlib and basemap.
This is the way I am doing it at the moment:
for ii in range(len(data)):
    lons = np.array([data['lon1'][ii],data['lon3'][ii],data['lon4'][ii],data['lon2'][ii]],'f2')
    lats = np.array([data['lat1'][ii],data['lat3'][ii],data['lat4'][ii],data['lat2'][ii]],'f2')
    x,y = m(lons,lats)
    poly = Polygon(zip(x,y),facecolor=colorval[ii],edgecolor='none')
    plt.gca().add_patch(poly)
However, this takes around 1.5 minutes on my machine and I was thinking whether it is possible to speed things up a little. Is there a more efficient way to draw polygons and add them to the map?
-
HyperCube over 11 yearsThx, nice example! I think PolyCollection is the key. However, I am confused how to turn my lons/lats into polygons. In your case "verts".
-
pelson over 11 years@JoeKington : Great addition. Unfortunately I will get the credit for all of your hard work...
-
pelson over 11 yearsFlawlessly and fast? How much time did you save from the original 1.5 minutes?
-
HyperCube over 11 yearsNow it takes 32 seconds, so it really speeds thing up!
-
Skylar Saveland almost 10 yearswhat is
m? Adding the imports/definitions would be nice. -
 Syrtis Major over 9 years@SkylarSaveland m is a Basemap object(in module mpl_toolkits.basemap). It can convert longitude and latitude into axes units for plotting a map.
 -
 PBrockmann about 2 yearsSame limitation... 27000 polygons to draw takes 15s. Not too bad but is the a way to improve this anyway ? Also is there a way to update only values once polygons have been drawn ?