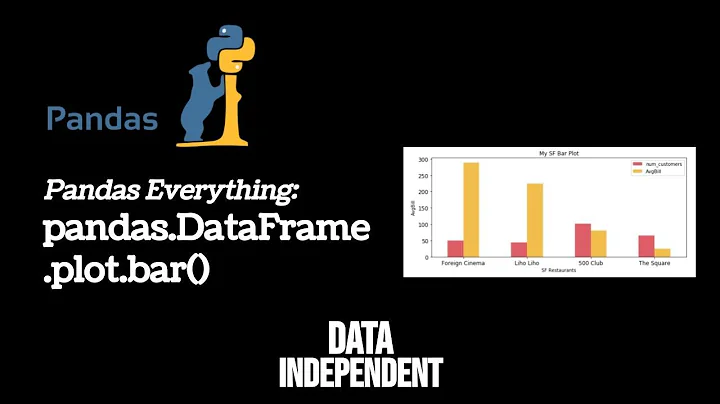
Edit the width of bars using dataframe.plot() function in matplotlib
Solution 1
For anyone coming across this question:
Since pandas 0.14, plotting with bars has a 'width' command: https://github.com/pydata/pandas/pull/6644
The example above can now be solved simply by using
df.plot(kind='bar', stacked=True, width=1)
See pandas.DataFrame.plot.bar or pandas.DataFrame.plot with kind='bar'.
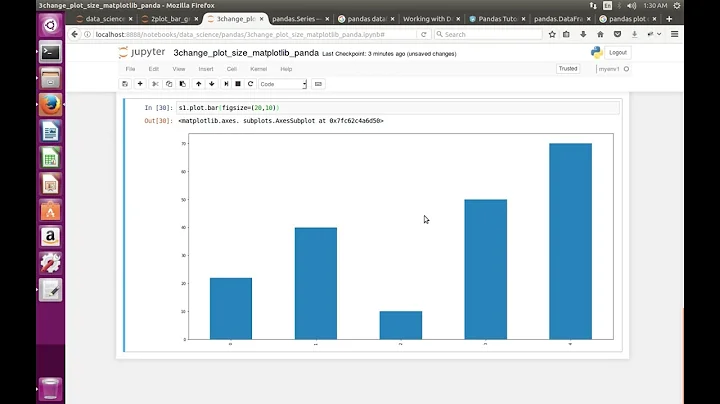
When changing the width of the bars, it might also be appropriate to change the figure size by specifying the figsize= parameter.
Solution 2
If think you have to "postprocess" the barplot with matplotlib as pandas internally sets the width of the bars.
The rectangles which form the bars are in container objects. So you have to iterate through these containers and set the width of the rectangles individually:
In [208]: df = pd.DataFrame(np.random.random((6, 5)) * 10,
                        index=list('abcdef'), columns=list('ABCDE'))

In [209]: df
Out[209]:
     A    B    C    D    E
a  4.2  6.7  1.0  7.1  1.4
b  1.3  9.5  5.1  7.3  5.6
c  8.9  5.0  5.0  6.7  3.8
d  5.5  0.5  2.4  8.4  6.4
e  0.3  1.4  4.8  1.7  9.3
f  3.3  0.2  6.9  8.0  6.1

In [210]: ax = df.plot(kind='bar', stacked=True, align='center')

In [211]: for container in ax.containers:
              plt.setp(container, width=1)
   .....:

In [212]: x0, x1 = ax.get_xlim()

In [213]: ax.set_xlim(x0 -0.5, x1 + 0.25)
Out[213]: (-0.5, 6.5)

In [214]: plt.tight_layout()

Related videos on Youtube
 10 : 35
 05 : 01
 11 : 11
 15 : 45
 02 : 58
 10 : 50
 04 : 00
 11 : 17
 15 : 44
 22 : 01
 01 : 12
 01 : 03
Osmond Bishop
Updated on July 09, 2022Comments
-
Osmond Bishop almost 2 years
I am making a stacked bar plot using:
DataFrame.plot(kind='bar',stacked=True)I want to control width of bars so that the bars are connected to each other like a histogram.
I've looked through the documentation but to no avail - any suggestions? Is it possible to do it this way?
-
 Andy Hayden about 11 yearsYou want to pass in width=1 (to bar) but plot won't let you... :s
 -
Rutger Kassies about 11 yearsStrange. The align keyword behaves as the opposite of mpl and the log keyword is also weird. @Osmond, i would workaround it by using: ax.bar(df.index.values, df.values)
-
-
zach almost 11 yearsnice answer. I didn't realize 'postprocessing' was an option
-
 CPBL about 10 yearsI am using df.plot to overplot additional bars on a preexisting bar plot. @bmu, your method does not work for me because it changes all the old plot objects, in addition to the new ones. How to change the width of just the bars newly created by df.plot()?
 -
bmu about 10 years@ChristopherBarrington-Leigh Maybe you could start the iteration over the container objects at a later index (at the number of your previous container objects), however an example would be better. I think you should better ask this in a separate question.
-
 Nav over 3 yearsWhile this is the right answer, it should also be known that increasing the width also makes the bars overlap onto the neighbouring ticks. The increase of width should also be accompanied with code that moves the tick positions proportionally to the right. I'm surprised the matplotlib creators didn't program this by default.
 -
 Dr Nisha Arora about 3 yearsNote that: the code will produce the same plot but not the same aesthetics. I've done some customization to reduce the chart junk.