Finding Memory leaks in C#
Solution 1
Overall Issue
The attempt to count and report on memory usage was handled in a way that takes 10,000 times more memory than the GC object allocation size that was being measured.
In addition, printing the handle counts was not applicable to the problem at hand (since no handles were being opened/closed in the test) but it did cause a significant allocation of memory (removing just that count cut the total allocations in half).
The original program was trying to measure allocation of 60-120 bytes of objects (depending on if it's a 32 or 64 bit program), but it did so using functions that caused 600 KB of memory to be allocated each time they were called, half of which was on the Large Object Heap (LOH).
An alternative way to test this is offered, which shows that all the objects are indeed gone after a GC.Collect call. Details are also provided on the memory usage of the DisplayMemory function.
Conclusions
The managed memory size doesn't increase when 100k objects are created and then collected. The private bytes of the process increase by about 12 KB when only 5 objects are created and collected, but SoS shows that it's not from the managed heap. When you are dealing with very small sizes and object counts you're not going to be able to determine exactly what is happening; instead I suggest testing with very large counts of objects so that it will be very easy to see if something is leaking. In this case, there is no leak, nothing is wrong, everything is fine.
Analysis Tools and Approach
I used two tools to review the memory usage by this program:
- VS 2013 Pro - Performance and Diagnostics Tool - I ran this first and saw that the original program was allocating 3.6 MB of memory, not just 60-120 bytes as would be expected from the object allocations. I knew that some memory would be used by the strings and writing to the console, but 3.6 MB was a shock.
- Son of Strike (SoS) - This is a debugger extension that works in Visual Studio and WinDbg and it ships with the .Net Framework (see sos.dll in each of the framework version directories on your machine).
VS 2013 Pro - Performance and Diagnostics Tool - Notes
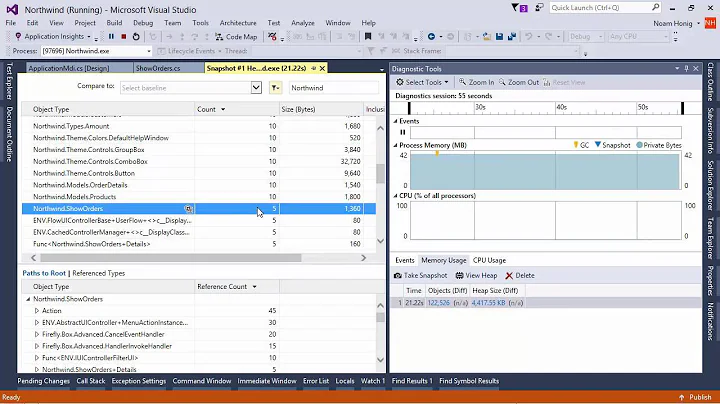
Results from running the original program under the Performance and Diagnostics Tool in VS 2013 Pro with the "profiling method" set to ".NET memory allocation" are below. This provided a very quick clue that way more memory was being allocated than thought. See the 3.6 MB of total allocations above the chart. If you remove the DisplayMemory calls that drops to 2,476 bytes.

Son of Strike - Notes
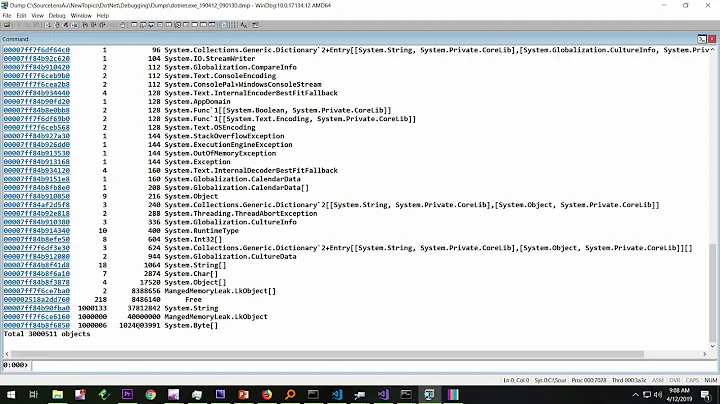
You can use SoS in VS2010 as long as you haven't installed .Net 4.5 on the machine, or you can use it in VS2012 with Update3; just make sure to enable unmanaged debugging in your project and make sure you're starting a 32 bit process, then run ".load sos" in the Immediate Window of the VS debugger. The commands I used to review this issue were "!eeheap -gc" and "!dumpheap -stat".
Alternative Test Program
class Program
{
    static void Main()
    {
        // A few objects get released by the initial GC.Collect call - the count drops from 108 to 94 objects in one test
        GC.Collect();

        // Set a breakpoint here, run these two sos commands:
        // !eeheap -gc
        // !dumpheap -stat
        for (int i = 0; i < 100000; i++)
        {
            object o = new object();
        }

        // Set a breakpoint here, run these two sos commands before this line, then step over and run them again
        // !eeheap -gc
        // !dumpheap -stat
        GC.Collect();
    }
}
Alternative Test Results
Summary
After allocating and collecting 100,000 System.Objects, we end up with 4 object fewer than we started with and a managed heap size that is 900 bytes smaller than we started with.
The garbage collection is working as expected.
Baseline - After First GC.Collect
!eeheap -gc
Number of GC Heaps: 1
generation 0 starts at 0x024f23d0
generation 1 starts at 0x024f100c
generation 2 starts at 0x024f1000
ephemeral segment allocation context: none
         segment             begin         allocated  size
024f0000  024f1000  024f23dc  0x13dc(5084)
Large object heap starts at 0x034f1000
         segment             begin         allocated  size
034f0000  034f1000  034f5380  0x4380(17280)
Total Size:              Size: 0x575c (22364) bytes.
------------------------------
GC Heap Size:    Size: 0x575c (22364) bytes.

!dumpheap -stat
Statistics:
      MT    Count    TotalSize Class Name
[...]
6ed026b8        1          112 System.AppDomain
6ed025b0        2          168 System.Threading.ThreadAbortException
6ed05d3c        1          284 System.Collections.Generic.Dictionary`2+Entry[[System.Type, mscorlib],[System.Security.Policy.EvidenceTypeDescriptor, mscorlib]][]
6ed03a6c        2          380 System.Int32[]
6ed0349c       20          560 System.RuntimeType
0047fab8       14         1024      Free
6ed02248       32         1692 System.String
6ecefe88        6        17340 System.Object[]
Total 95 objects
After Allocating 100,000 System.Objects, Before Final GC.Collect
!eeheap -gc
Number of GC Heaps: 1
generation 0 starts at 0x024f23d0
generation 1 starts at 0x024f100c
generation 2 starts at 0x024f1000
ephemeral segment allocation context: none
         segment             begin         allocated  size
024f0000  024f1000  02617ff4  0x126ff4(1208308)
Large object heap starts at 0x034f1000
         segment             begin         allocated  size
034f0000  034f1000  034f5380  0x4380(17280)
Total Size:              Size: 0x12b374 (1225588) bytes.
------------------------------
GC Heap Size:    Size: 0x12b374 (1225588) bytes.

!dumpheap -stat
Statistics:
      MT    Count    TotalSize Class Name
[...]
6ed024e4        1           84 System.OutOfMemoryException
6ed02390        1           84 System.Exception
6ed026b8        1          112 System.AppDomain
6ed025b0        2          168 System.Threading.ThreadAbortException
6ed05d3c        1          284 System.Collections.Generic.Dictionary`2+Entry[[System.Type, mscorlib],[System.Security.Policy.EvidenceTypeDescriptor, mscorlib]][]
6ed03a6c        2          380 System.Int32[]
6ed0349c       20          560 System.RuntimeType
0047fab8       14         1024      Free
6ed02248       32         1692 System.String
6ecefe88        6        17340 System.Object[]
6ed025e8   100002      1200024 System.Object
Total 100095 objects
After Final GC.Collect
!eeheap -gc
Number of GC Heaps: 1
generation 0 starts at 0x024f2048
generation 1 starts at 0x024f2030
generation 2 starts at 0x024f1000
ephemeral segment allocation context: none
         segment             begin         allocated  size
024f0000  024f1000  024f2054  0x1054(4180)
Large object heap starts at 0x034f1000
         segment             begin         allocated  size
034f0000  034f1000  034f5380  0x4380(17280)
Total Size:              Size: 0x53d4 (21460) bytes.
------------------------------
GC Heap Size:    Size: 0x53d4 (21460) bytes.

!dumpheap -stat
Statistics:
      MT    Count    TotalSize Class Name
[...]
6ed024e4        1           84 System.OutOfMemoryException
6ed02390        1           84 System.Exception
6ed026b8        1          112 System.AppDomain
0047fab8        9          118      Free
6ed025b0        2          168 System.Threading.ThreadAbortException
6ed05d3c        1          284 System.Collections.Generic.Dictionary`2+Entry[[System.Type, mscorlib],[System.Security.Policy.EvidenceTypeDescriptor, mscorlib]][]
6ed03a6c        2          380 System.Int32[]
6ed0349c       20          560 System.RuntimeType
6ed02248       32         1692 System.String
6ecefe88        6        17340 System.Object[]
Total 91 objects
Review of the DisplayMemory Function's Memory Usage
Compared to the System.Object allocations, DisplayMemory is a memory hog. It's creating strings (which go on the heap), and the functions it calls to get memory are using tons (roughly 600 KB) of memory themselves.
Memory Usage Before Calling DisplayMemory
!eeheap -gc
Number of GC Heaps: 1
generation 0 starts at 0x02321018
generation 1 starts at 0x0232100c
generation 2 starts at 0x02321000
ephemeral segment allocation context: none
         segment             begin         allocated  size
02320000  02321000  02323ff4  0x2ff4(12276)
Large object heap starts at 0x03321000
         segment             begin         allocated  size
03320000  03321000  03325380  0x4380(17280)
Total Size:              Size: 0x7374 (29556) bytes.
------------------------------
GC Heap Size:    Size: 0x7374 (29556) bytes.

!dumpheap -stat
Statistics:
      MT    Count    TotalSize Class Name
[...]
6ed05d3c        3          468 System.Collections.Generic.Dictionary`2+Entry[[System.Type, mscorlib],[System.Security.Policy.EvidenceTypeDescriptor, mscorlib]][]
6ed0349c       20          560 System.RuntimeType
6ed02248       38         2422 System.String
6ecefe88        6        17340 System.Object[]
Total 102 objects
Memory Usage After Calling DisplayMemory
!eeheap -gc
Number of GC Heaps: 1
generation 0 starts at 0x023224fc
generation 1 starts at 0x023224f0
generation 2 starts at 0x02321000
ephemeral segment allocation context: none
         segment             begin         allocated  size
02320000  02321000  02371ff4  0x50ff4(331764)
Large object heap starts at 0x03321000
         segment             begin         allocated  size
03320000  03321000  033653c0  0x443c0(279488)
Total Size:              Size: 0x953b4 (611252) bytes.
------------------------------
GC Heap Size:    Size: 0x953b4 (611252) bytes.

!dumpheap -stat
Statistics:
      MT    Count    TotalSize Class Name
[...]
6ed02c08        9          954 System.Char[]
006dfac0       17         1090      Free
6ed03aa4      156         1872 System.Int32
6ecffc20      152         3648 System.Collections.ArrayList
6ed05ed4        9         7776 System.Collections.Hashtable+bucket[]
7066e388      152        16416 System.Diagnostics.ProcessInfo
6ed02248      669        20748 System.String
706723e4      152        29184 System.Diagnostics.NtProcessInfoHelper+SystemProcessInformation
6ecefe88      463        48472 System.Object[]
706743a4     2104        75744 System.Diagnostics.ThreadInfo
70666568     2104       151488 System.Diagnostics.NtProcessInfoHelper+SystemThreadInformation
6ed0d640        2       262168 System.Int64[]
Total 6132 objects
Solution 2
I have the following results:
Total memory: 94.804 bytes
Private bytes 19230720
Handle count: 252

--- New object #1 ---
Total memory: 96.932 bytes
Private bytes 19820544
Handle count: 252

--- New object #2 ---
Total memory: 96.932 bytes
Private bytes 19820544
Handle count: 252

--- New object #3 ---
Total memory: 96.932 bytes
Private bytes 19820544
Handle count: 252

--- New object #4 ---
Total memory: 96.932 bytes
Private bytes 19820544
Handle count: 252

--- New object #5 ---
Total memory: 96.932 bytes
Private bytes 19820544
Handle count: 252

--- press any key to quit ---
Total memory: 96.920 bytes
Private bytes 19820544
Handle count: 252
class Program
{
static void DisplayMemory()
{
    Console.WriteLine("Total memory: {0:###,###,###,##0} bytes", GC.GetTotalMemory(true));
    Console.WriteLine("Private bytes {0}", System.Diagnostics.Process.GetCurrentProcess().PrivateMemorySize64);
  Console.WriteLine("Handle count: {0}", System.Diagnostics.Process.GetCurrentProcess().HandleCount);
    Console.WriteLine();
 }

 static void Main()
 {
  DisplayMemory();
  GC.Collect();
  GC.WaitForPendingFinalizers();
  GC.Collect();

   for (int i = 0; i < 5; i++)
   {
     Console.WriteLine("--- New object #{0} ---", i + 1);

     object o = new object();

     GC.Collect();
     GC.WaitForPendingFinalizers();
     GC.Collect();

     DisplayMemory();
   }

   Console.WriteLine("--- press any key to quit ---");
  //Console.ReadLine();

  GC.Collect();
  GC.WaitForPendingFinalizers();
  GC.Collect();

  GC.WaitForFullGCComplete();
  DisplayMemory();

  Console.ReadLine();
}
I just removed the Console.ReadLine(); and adding GC.WaitForPendingFinalizers();.
Now the code working as you wish it is seem to be Console.ReadLine() does not free the resources directly!
Solution 3
GC.Collect is asynchronous, so the logic of calling DisplayMemory() straight after GC.Collect(); is questionable. Run GC.Collect synchronously has some detail about GC.WaitForPendingFinalizers().
Edit - in reply to your question:
Total memory: 84,280 bytes
Private bytes 15384576
Handle count: 245

--- New object #1 ---
Total memory: 86,408 bytes
Private bytes 15908864
Handle count: 245

--- New object #2 ---
Total memory: 86,408 bytes
Private bytes 15908864
Handle count: 245

--- New object #3 ---
Total memory: 86,408 bytes
Private bytes 15908864
Handle count: 245

--- New object #4 ---
Total memory: 86,408 bytes
Private bytes 15908864
Handle count: 245

--- New object #5 ---
Total memory: 86,408 bytes
Private bytes 15908864
Handle count: 245
So it doesn't seem to make a lot of difference here!
Solution 4
Total memory: 160,144 bytes Private bytes 27189248 Handle count: 247
--- New object #1 --- s Total memory: 160,152 bytes Private bytes 27979776 Handle count: 247
--- New object #2 --- s Total memory: 160,152 bytes Private bytes 27979776 Handle count: 247
--- New object #3 --- Total memory: 160,152 bytes Private bytes 27979776 Handle count: 247
--- New object #4 --- s Total memory: 160,152 bytes Private bytes 27979776 Handle count: 247
--- New object #5 --- s Total memory: 160,152 bytes Private bytes 27975680 Handle count: 247
--- press any key to quit ---
Total memory: 160,152 bytes Private bytes 27996160 Handle count: 247
    static void Main()
    {
        DisplayMemory();
        GC.Collect();
        GC.WaitForFullGCComplete();
        for (int i = 0; i < 5; i++)
        {
            Console.WriteLine("--- New object #{0} ---", i + 1);

            object o = new object();

            GC.Collect();
            GC.WaitForFullGCComplete();
            Console.Read();
            Console.Read();
            DisplayMemory();

        }
        Console.WriteLine("--- press any key to quit ---");
        Console.WriteLine();
        Console.Read();
        Console.Read();

        GC.Collect();
        GC.WaitForFullGCComplete();
        DisplayMemory();
    }
Solution 5
I tested your code. The first two output you got is following:
Output:
=======
Total memory: 16,940 bytes
Private bytes 8134656
Handle count: 115

--- New object #1 ---
Total memory: 25,588 bytes
Private bytes 8540160
Handle count: 115
There is significant rise in memory usage here and that is because the use of static class Console (Console.WriteLine) in the DisplayMemory() method. It is not because you are creating object in the loop multiple times. The object creation in the loop only creates 120 bytes in total memory but use of Console class uses roughly 8000 bytes in total memory. Try following code and you will understand.
static void Main()
        {
            DisplayMemory();
            List<object> objList = new List<object>();
            for (int i = 0; i < 15; i++)
            {
                Console.WriteLine("--- New object #{0} ---", i + 1);

                object o = new object();
                            objList.Add(o);
                DisplayMemory();
            }

            GC.Collect();


            DisplayMemory();
            Console.WriteLine("--- press any key to quit ---");

            Console.ReadLine();
        }
Observe, each time the object is created, total memory rises by 120 bytes.
Related videos on Youtube
 05 : 17
 06 : 34
 10 : 49
 37 : 32
 13 : 09
 17 : 25
user186246
Updated on June 22, 2022Comments
-
user186246 almost 2 years
In the following program the size of initial size of memory is not regained though garbage collection is performed. 1. Initial size of memory is Total memory: 16,940 bytes Private bytes 8134656
Created objects within a loop so that these objects are freed when gc collect is done outside the loop as these objects don't have their scope.
But the memory after GC collect is not same as the initial size Total memory: 29,476 bytes Private bytes 8540160 Handle count: 115
using System;
using System.Collections.Generic;
using System.Linq;
using System.Text;

namespace MemoryLeakTest
{

    class Program
    {
        static void DisplayMemory()
        {
            Console.WriteLine("Total memory: {0:###,###,###,##0} bytes", GC.GetTotalMemory(true));
            Console.WriteLine("Private bytes {0}", System.Diagnostics.Process.GetCurrentProcess().PrivateMemorySize64);
            Console.WriteLine("Handle count: {0}", System.Diagnostics.Process.GetCurrentProcess().HandleCount);
            Console.WriteLine();
        }

        static void Main()
        {
            DisplayMemory();
            GC.Collect();
            for (int i = 0; i < 5; i++)
            {
                Console.WriteLine("--- New object #{0} ---", i + 1);

                object o = new object();

                GC.Collect();
                DisplayMemory();
            }
            Console.WriteLine("--- press any key to quit ---");
            Console.WriteLine();
            Console.Read();

            GC.Collect();
            DisplayMemory();
        }

    }
}

Output:
=======
Total memory: 16,940 bytes
Private bytes 8134656
Handle count: 115

--- New object #1 ---
Total memory: 25,588 bytes
Private bytes 8540160
Handle count: 115

--- New object #2 ---
Total memory: 25,576 bytes
Private bytes 8540160
Handle count: 115

--- New object #3 ---
Total memory: 25,576 bytes
Private bytes 8540160
Handle count: 115

--- New object #4 ---
Total memory: 25,576 bytes
Private bytes 8540160
Handle count: 115

--- New object #5 ---
Total memory: 25,576 bytes
Private bytes 8540160
Handle count: 115

--- press any key to quit ---


Total memory: 29,476 bytes
Private bytes 8540160
Handle count: 115

*********************************
What is the reason for the increase in private bytes and managed heap size from their initial size?
-
George Stocker over 10 yearsWhen the .NET Runtime reserves memory, it doesn't give it back right away when it's no longer actually using that memory -- nor should it.
-
George Stocker over 10 yearsThis has been talked about on Stack Overflow before: stackoverflow.com/questions/1343374/…
-
user186246 over 10 yearsIf the private bytes gets increased and reserved like this then the other processes cannot use this memory as private bytes are not shared. Is this right?
-
user1703401 over 10 yearsIt strikes me that you completely asked the wrong question. You should have asked why Total Memory goes down or remains the same, even though you allocate objects. Clearly there's a lot more to memory management than meets the eye, covered well in many books about .NET.
-
user186246 over 10 yearsYes, I am having confusion in unusual increase\decrease of private bytes and heap size
-
 Tim Child over 10 yearsWhat are your expectation of how C# memory allocation should work here?
 -
 huntharo almost 10 years@user186246 - Any reason why no answer was accepted below?
-
user186246 over 10 yearsI tried with synchronous GC collect even then found the same result. Can you please run the program and check?
-
 Нет войне over 10 yearsOutput added - it doesn't seem to make a lot of difference here!:)
 -
user007 over 10 yearsyou are missing last part: --- press any key to quit --- Total memory: xxxxxx bytes Private bytes xxxxxxxxx Handle count: xx
-
user186246 over 10 yearsIf you compare the initial size of total memory and private bytes with their last values you can still find an increment. Why GC doesn't frees memory properly?
-
 Bassam Alugili over 10 years@user186246 But you still have some data in console and some object are created we need profiler to prof where is the problem this weekend i will check it out with a profiler..