Fit a gaussian function
Solution 1
Take a look at this answer for fitting arbitrary curves to data. Basically you can use scipy.optimize.curve_fit to fit any function you want to your data. The code below shows how you can fit a Gaussian to some random data (credit to this SciPy-User mailing list post).
import numpy
from scipy.optimize import curve_fit
import matplotlib.pyplot as plt

# Define some test data which is close to Gaussian
data = numpy.random.normal(size=10000)

hist, bin_edges = numpy.histogram(data, density=True)
bin_centres = (bin_edges[:-1] + bin_edges[1:])/2

# Define model function to be used to fit to the data above:
def gauss(x, *p):
    A, mu, sigma = p
    return A*numpy.exp(-(x-mu)**2/(2.*sigma**2))

# p0 is the initial guess for the fitting coefficients (A, mu and sigma above)
p0 = [1., 0., 1.]

coeff, var_matrix = curve_fit(gauss, bin_centres, hist, p0=p0)

# Get the fitted curve
hist_fit = gauss(bin_centres, *coeff)

plt.plot(bin_centres, hist, label='Test data')
plt.plot(bin_centres, hist_fit, label='Fitted data')

# Finally, lets get the fitting parameters, i.e. the mean and standard deviation:
print 'Fitted mean = ', coeff[1]
print 'Fitted standard deviation = ', coeff[2]

plt.show()
Solution 2
You can try sklearn gaussian mixture model estimation as below :
import numpy as np
import sklearn.mixture

gmm = sklearn.mixture.GMM()

# sample data
a = np.random.randn(1000)

# result
r = gmm.fit(a[:, np.newaxis]) # GMM requires 2D data as of sklearn version 0.16
print("mean : %f, var : %f" % (r.means_[0, 0], r.covars_[0, 0]))
Reference : http://scikit-learn.org/stable/modules/mixture.html#mixture
Note that in this way, you don't need to estimate your sample distribution with an histogram.
Solution 3
Kind of an old question, but for anybody looking just to plot a density fit for a series, you could try matplotlib's .plot(kind='kde'). Docs here.
Example with pandas:
mydf.x.plot(kind='kde')
Solution 4
I am not sure what your input is, but possibly your y-axis scale is too large (20000), try reducing this number. The following code works for me:
import matplotlib.pyplot as plt
import numpy as np

#created my variable
v = np.random.normal(0,1,1000)


fig, ax = plt.subplots()


plt.hist(v, bins=500, normed=1, color='#7F38EC', histtype='step')

#plot
plt.title("Gaussian")
plt.axis([-1, 2, 0, 1]) #changed 20000 to 1

plt.show()
Edit:
If you want the actual count of values on y-axis, you can set normed=0. And would just get rid of the plt.axis([-1, 2, 0, 1]).
import matplotlib.pyplot as plt
import numpy as np

#function
v = np.random.normal(0,1,500000)


fig, ax = plt.subplots()

# changed normed=1 to normed=0
plt.hist(v, bins=500, normed=0, color='#7F38EC', histtype='step')

#plot
plt.title("Gaussian")
#plt.axis([-1, 2, 0, 20000])

plt.show()
Related videos on Youtube
 04 : 27
 05 : 45
 13 : 50
 29 : 09
 13 : 27
 21 : 42
 06 : 04
Chris
A full-stack web application developer, working at Enable.
Updated on February 05, 2020Comments
-
Chris over 4 years
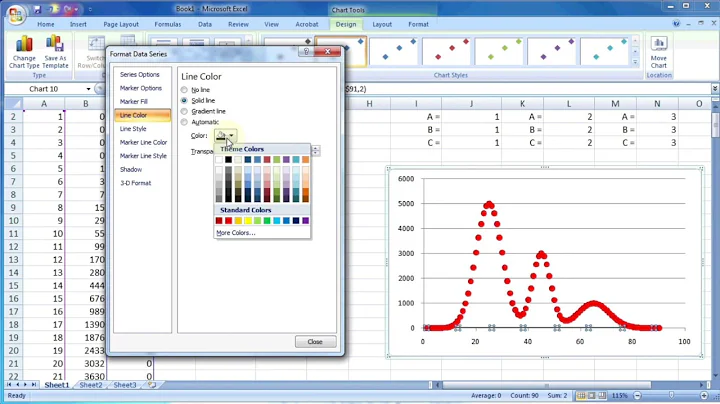
I have a histogram (see below) and I am trying to find the mean and standard deviation along with code which fits a curve to my histogram. I think there is something in SciPy or matplotlib that can help, but every example I've tried doesn't work.
import matplotlib.pyplot as plt import numpy as np with open('gau_b_g_s.csv') as f: v = np.loadtxt(f, delimiter= ',', dtype="float", skiprows=1, usecols=None) fig, ax = plt.subplots() plt.hist(v, bins=500, color='#7F38EC', histtype='step') plt.title("Gaussian") plt.axis([-1, 2, 0, 20000]) plt.show()-
Jodaka almost 12 yearsWhat do you mean by doesn't work? It doesn't run, or the output isn't correct?
-
 Admin almost 12 yearsI can't get the codes from the internet to run, to actually make a curve like they are supposed to
 -
Admin almost 12 yearswhich is most likely happening because I just started programming and I generally have no idea what i'm doing
-
Jodaka almost 12 yearsSo are you getting an error message when you try to run it? Or does the program complete without producing anything?
-
Admin almost 12 yearsI just don't know how to properly make it work with my data
-
-
Admin almost 12 yearsno im working with over half a million points so I want the scale to be that big because I don't want like 50,000 bins
-
 Akavall almost 12 years@I believe the value on y-axis does not tell you the number of observations in each bin, it tells you percentage in each bin. Just comment out the whole
plt.axis([-1, 2, 0, 1])line and run it, you should get a distribution plot. -
Admin almost 12 yearsthanks, this got the mean and sd well, but the curve fit doesn't actually produce a curve, it produces lines
-
Chris almost 12 yearsDo you mean my example just produces lines? Or when you apply the above code to your data you get lines? Also, what is the difference between a line and a curve?
-
Admin almost 12 yearsas opposed to bell curve type shape, it just looks like a carrot ^
-
Admin almost 12 yearsits definitely telling me the number in each bin because i can see the histogram itself with the y axis at 20,000
-
Chris almost 12 yearsWithout more information I can't really help you. Do you mean it looks like a carrot with your data? If so, then presumably it is because that is what your data looks like. When asking questions it is best to include a short, self contained example.
-
SuperElectric about 11 yearsI suspect @user1496646 means that, in his case, there aren't that many <bin_centres>, so when you plot(bin_centres, hist_fit), it comes out poorly sampled Gaussian ("carrot"). He should just subsample the bin_centers, using new_bin_centers = numpy.linspace(bin_centres[0], bin_centres[-1], 200), new_hist_fit = gauss(new_bin_centres, *coeff), and plot(new_bin_centres, new_hist_fit)
-
Akavall almost 11 yearsDownvoter, can you please explain the reason for the downvote?
-
 Joseph Farah almost 6 yearswow, TIL matplotlib has kernel density estimation built in. +1
 -
jjc385 over 3 years
sklearn.mixture.GMMseems to have been replaced withsklearn.mixture.GaussianMixtureat some point.