Forecasting with time series in python
14,866
To examine the ARMA model in a sample group:
import pandas as pd
from pandas.tseries.offsets import *
import numpy as np
import matplotlib.pyplot as plt
import statsmodels.api as sm
csv_file = '/home/Jian/Downloads/analyse vtr.csv'
df = pd.read_csv(csv_file, index_col=[0], sep='\t')
grouped = df.groupby('adserver_id')
group = list(grouped)[0][1]
ts_data = pd.TimeSeries(group.c_start.values, index=pd.to_datetime(group.day))
# positive-valued process, looks non-stationary
# simple way is to do a log transform
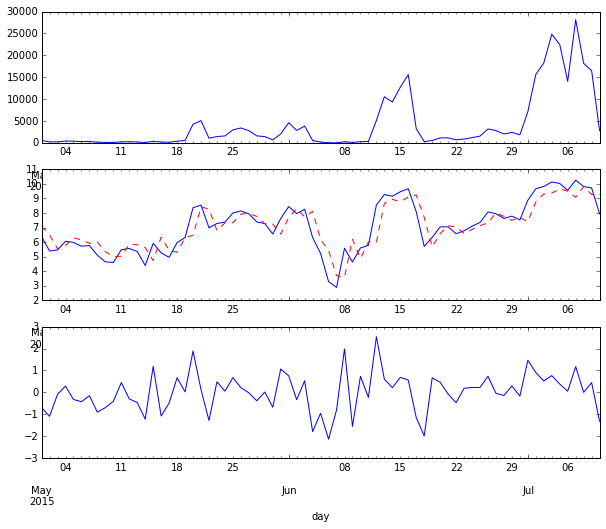
fig, axes = plt.subplots(figsize=(10,8), nrows=3)
ts_data.plot(ax=axes[0])
ts_log_data = np.log(ts_data)
ts_log_data.plot(ax=axes[1], style='b-', label='actual')
# in-sample fit
# ===================================
model = sm.tsa.ARMA(ts_log_data, order=(1,1)).fit()
print(model.params)
y_pred = model.predict(ts_log_data.index[0].isoformat(), ts_log_data.index[-1].isoformat())
y_pred.plot(ax=axes[1], style='r--', label='in-sample fit')
y_resid = model.resid
y_resid.plot(ax=axes[2])
# out-sample predict
# ===================================
start_date = ts_log_data.index[-1] + Day(1)
end_date = ts_log_data.index[-1] + Day(7)
y_forecast = model.predict(start_date.isoformat(), end_date.isoformat())
print(y_forecast)
2015-07-11 7.5526
2015-07-12 7.4584
2015-07-13 7.3830
2015-07-14 7.3224
2015-07-15 7.2739
2015-07-16 7.2349
2015-07-17 7.2037
Freq: D, dtype: float64
# NOTE: this step introduces bias, it is used here just for simplicity
# E[exp(x)] != exp[E[x]]
print(np.exp(y_forecast))
2015-07-11 1905.6328
2015-07-12 1734.4442
2015-07-13 1608.3362
2015-07-14 1513.8595
2015-07-15 1442.1183
2015-07-16 1387.0486
2015-07-17 1344.4080
Freq: D, dtype: float64
To run the ARMA model for each subgroup (really time consuming):
import pandas as pd
from pandas.tseries.offsets import *
import numpy as np
import matplotlib.pyplot as plt
import statsmodels.api as sm
csv_file = '/home/Jian/Downloads/analyse vtr.csv'
df = pd.read_csv(csv_file, index_col=[0], sep='\t')
grouped = df.groupby('adserver_id')
def forecast_func(group):
    ts_log_data = np.log(pd.TimeSeries(group.c_start.values, index=pd.to_datetime(group.day)))
    # for some group, it raise convergence issue
    try:
        model = sm.tsa.ARMA(ts_log_data, order=(1,1)).fit()
        start_date = ts_log_data.index[-1] + Day(1)
        end_date = ts_log_data.index[-1] + Day(7)
        y_forecast = model.predict(start_date.isoformat(), end_date.isoformat())
        return pd.Series(np.exp(y_forecast).values, np.arange(1, 8))
    except Exception:
        pass
result = df.groupby('adserver_id').apply(forecast_func)
Alternative models: for fast computation, consider exponential smoothing; Also, I see the data looks like a positive-valued process with a time-varying Possion distribution, might consider state-space model using pymc module.
Author by
Admin
Updated on June 11, 2022Comments
-
 Admin less than a minute
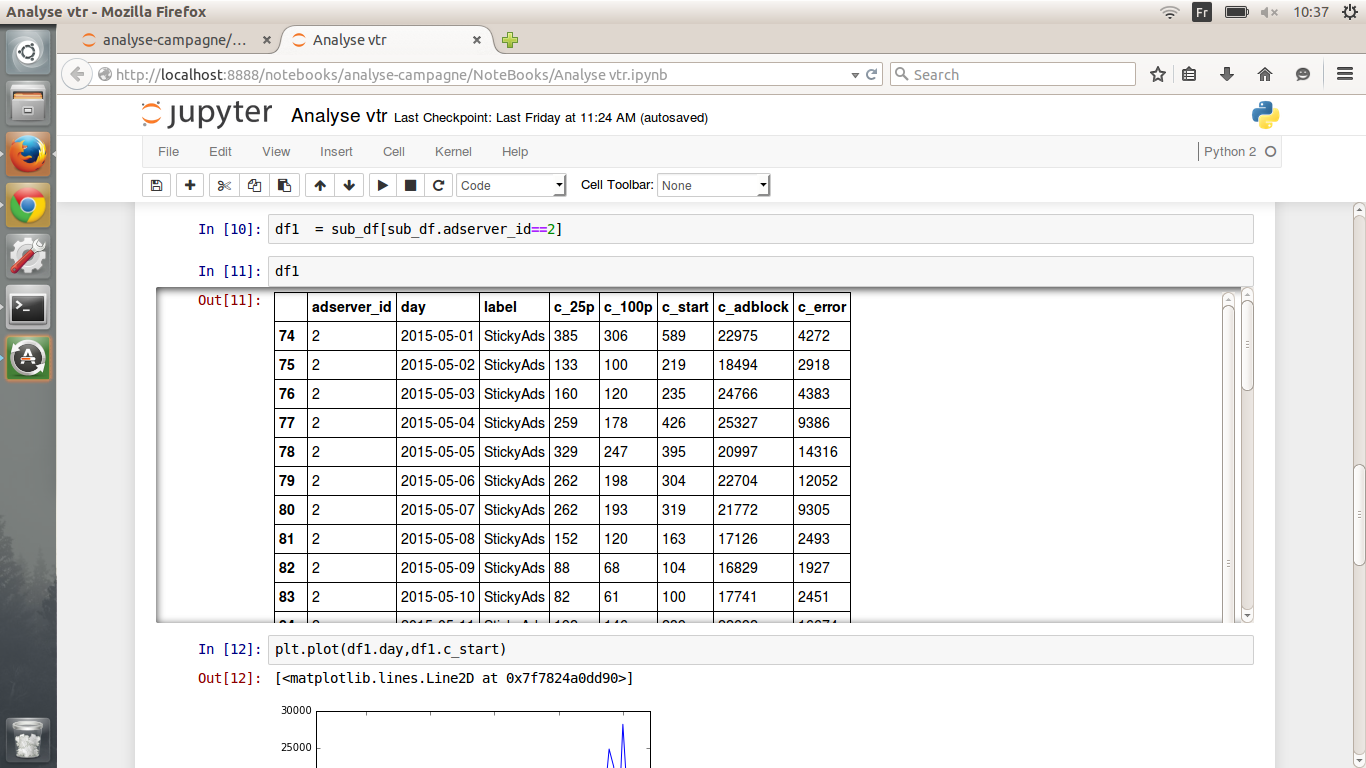
I need some help from you guys. I actually want to predict the next values of a variable Y (c_start) when X (day) represent the time. As you can see in the picture, i have values for the attribute "c_start" and I would like to predict the next "c_start" values for the next 7 days(for example). May someone help me?
Thx guys!