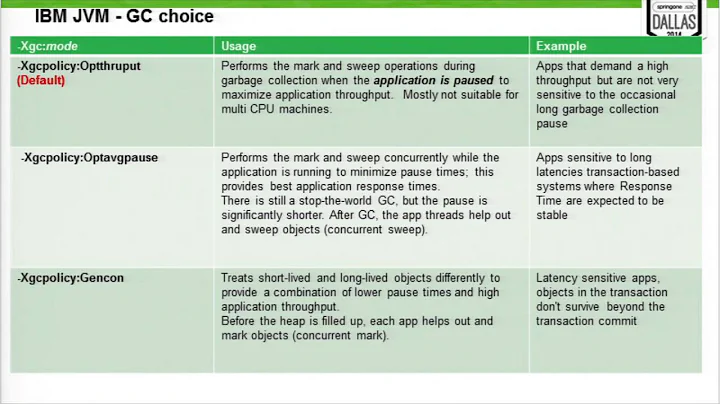
GC Tuning - preventing a Full GC
Solution 1
The log snippet posted shows you have a substantial number of objects that are live for >320s (approx 40s per young collection and objects survive through 8 collections before promotion). The remaining objects then bleed into tenured and eventually you hit an apparently unexpected full gc which doesn't actually collect very much.
3453285K->3099828K(4194304K)
i.e. you have a 4G tenured which is ~82% full (3453285/4194304) when it is triggered and is ~74% full after 13 long seconds.
This means it took 13s to collect the grand total of ~350M which, in the context of a 6G heap is not v much.
This basically means your heap is not big enough or, perhaps more likely, you have a memory leak. A leak like this is a terrible thing for CMS because a concurrent tenured collection is a non compacting event which means tenured is a collection of free lists which means fragmentation can be a big problem for CMS which means that your utilisation of tenured becomes increasingly inefficient which means that there is an increased probability of promotion failure events (though if this were such an event then I'd expect to see a log message saying that) because it wants to promote (or thinks it will need to promote) X MB into tenured but it does not have a (contiguous) free list >= X MB available. This triggers an unexpected tenured collection which is a not remotely concurrent STW event. If you actually have v little to collect (as you do) then there is no surprise you're sitting twiddling your thumbs.
Some general pointers, to a large extent reiterating what Vladimir Sitnitov has said...
- using iCMS on a multicore box makes no sense (unless you have lots of JVMs or other processes running on that box such that the JVM really is short of CPU) therefore remove this switch
- your young collections are unnecessarily long because of the impact of copying relatively substantial quantities of memory between the survivor spaces on every collection, 150-200ms is a really quite massive
ParNewcollection- the right answer to the young gen issue depends on what the allocation behaviour really is (e.g. perhaps you'd be better off tenuring early and reducing the impact of fragmentation on tenured collections OR perhaps you'd be better off having a much more massive new gen and reducing the frequency of young gen collections such that fewer objects are promoted so that there is minimal bleed into tenured).
Some questions...
- does it eventually go OoM or does it recover?
- is the application in a steady state (subject to consistent load at some point well beyond startup) during this log snippet or is it under stress?
Solution 2
I'm serving requests and expect that beyond a certain amount of shared objects, every other objects are useful only to the request at hand. That's the theory, but any kind of caches can easily void that assumption and create objects that live beyond the request.
As others have noted neither your huge young generation nor the extended tenuring seems to work.
You should profile your application and analyze the age-distribution of objects. I'm pretty sure Grails caches all kinds of things beyond the scope of a request and that's what leaks into the old gen.
What you're essentially trying is to sacrifice the young generation pause times (for a young gen of 2GB) to postpone the inevitable - an old gen collection of 6GB. This is not exactly a good tradeoff you're making there.
Instead you probably should aim for better young gen pause times and allow CMS to burn more CPU time: more conrrent-phase GC threads (can't remember the option for that one), higher GCTimeRatio, a MaxGCPauseMillis > MaxGCMinorPauseMillis to take pressure of the minor collections and allow them to meet their pause goals instead of having to resize to fit the major collection limit.
To make major GCs less painful you might want to read this: http://blog.ragozin.info/2012/03/secret-hotspot-option-improving-gc.html (this patch should be in j7u4). CMSParallelRemarkEnabled should be enabled too, not sure if this is the default.
Alternative: Use G1GC
Personally I have some horrible experiences with G1GC working itself into a corner due to some very large LRU-like workloads and then falling back to a large, stop-the-world collection far more often than CMS experienced concurrent mode failures for the same workload.
But for other workloads (like yours) it might actually do the job and collect the old generation incrementally, while also compacting and thus avoiding any big pauses.
Give it a try if you haven't already. Again, update to the newest java7 before you do so, G1 still has some issues with its heuristics that they're trying to iron out.
Edit: Oracle has improved G1GC's heuristics and some bottlenecks since I have written this answer. It should definitely be worth a try now.
Another alternative: Throughput collector
As you're already using a parallel collector for a 2GB young gen and get away with 200ms pause times... why not try the parallel old gen collector on your 6G heap? It would probably take less than the 10s+ major collections you're seeing with CMS. Whenever CMS runs into one of its failure modes it does a single-threaded, stop-the-world collection.
Solution 3
Please, describe how many CPUs can be used for Tomcat? 4?
What java version are you using? (>1.6.0u23 ?)
0) From the Full GC output, it definitely looks like you are hitting memory limit: even after full gc, there is still 3099828K of used memory (out of 4194304K). There is just no way to prevent Full GC when you are out of memory.
Is 3.1Gb working set expected for your application? That is 3.1Gb of non-garbage memory!
If that is expected, it is time to increase -Xmx/-Xms. Otherwise, it is time to collect and analyze heap dump to identify memory hog.
After you solve the problem of 3Gb working set, you may find the following advice useful: From my point of view, regular (non incremental) CMS mode, and reducing NewSize are worth trying.
1) Incremental mode is targeted at single cpu machines, when CMS thread yields CPU to other threads.
In case you have some spare CPU (e.g. you are running multicore machine) it is better to perform GC in the background without yields.
Thus I would recommend removing -XX:+CMSIncrementalMode.
2) -XX:CMSInitiatingOccupancyFraction=60 tells CMS to start background GC after OLD gen is 60% full.
In case there is garbage in the heap, and CMS does not keep up with it, it makes sense lowering CMSInitiatingOccupancyFraction. For instance, -XX:CMSInitiatingOccupancyFraction=30, so CMS would start concurrent collection when old gen is 30% full. Currently it is hard to tell if it is the case, since you just do not have garbage in the heap.
3) Looks like "extended tenuring" does not help -- the objects just do not die out even after 7-8 tenurings. I would recommend reducing SurvivorRatio (e.g., SurvivorRatio=2, or just remove the option and stick with default). That would reduce the number of tenurings resulting in reduced minor gc pauses.
4) -XX:NewSize=2G. Did you try lower values for NewSize? Say, NewSize=512m. That should reduce minor gc pauses and make promotions young->old less massive, simplifying work for CMS.
Solution 4
Your survivor sizes aren't decreasing much, if at all - ideally they should be decreasing steeply, because you only want a minority of objects to survive long enough to reach the Old generation.
This suggests that many objects are living a relatively long time - which can happen when you have many open connections, threads etc that are not handled quickly, for example.
(Do you have any options to change the application, incidentally, or can you only modify the GC settings? There might also be Tomcat settings that would have an effect...)
Related videos on Youtube
 05 : 35
 44 : 20
 24 : 48
 51 : 55
 52 : 02
 38 : 39
 01 : 32 : 28
 17 : 57
 32 : 49
 53 : 09
Kalisen
In a senior leadership position, I will grow the organization by defining and executing on a Technology strategy to achieve the goals of the business. I will build, lead and empower teams to successfully deliver complex systems (stable, secure, scalable, data heavy) based on my extensive experience architecting, designing and building scalable and distributed web applications.
Updated on March 08, 2020Comments
-
Kalisen about 4 years
I'm trying to avoid the Full GC (from gc.log sample below) running a Grails application in Tomcat in production. Any suggestions on how to better configure the GC?
14359.317: [Full GC 14359.317: [CMS: 3453285K->3099828K(4194304K), 13.1778420 secs] 4506618K->3099828K(6081792K), [CMS Perm : 261951K->181304K(264372K)] icms_dc=0 , 13.1786310 secs] [Times: user=13.15 sys=0.04, real=13.18 secs]
My VM params are as follow:
-Xms=6G
-Xmx=6G
-XX:MaxPermSize=1G
-XX:NewSize=2G
-XX:MaxTenuringThreshold=8
-XX:SurvivorRatio=7
-XX:+UseConcMarkSweepGC
-XX:+CMSClassUnloadingEnabled
-XX:+CMSPermGenSweepingEnabled
-XX:+CMSIncrementalMode
-XX:CMSInitiatingOccupancyFraction=60
-XX:+UseCMSInitiatingOccupancyOnly
-XX:+HeapDumpOnOutOfMemoryError
-XX:+PrintGCDetails
-XX:+PrintGCTimeStamps
-XX:+PrintTenuringDistribution
-Dsun.reflect.inflationThreshold=014169.764: [GC 14169.764: [ParNew Desired survivor size 107347968 bytes, new threshold 8 (max 8) - age 1: 15584312 bytes, 15584312 total - age 2: 20053704 bytes, 35638016 total - age 3: 13624872 bytes, 49262888 total - age 4: 14469608 bytes, 63732496 total - age 5: 10553288 bytes, 74285784 total - age 6: 11797648 bytes, 86083432 total - age 7: 12591328 bytes, 98674760 total : 1826161K->130133K(1887488K), 0.1726640 secs] 5216326K->3537160K(6081792K) icms_dc=0 , 0.1733010 secs] [Times: user=0.66 sys=0.03, real=0.17 secs] 14218.712: [GC 14218.712: [ParNew Desired survivor size 107347968 bytes, new threshold 8 (max 8) - age 1: 25898512 bytes, 25898512 total - age 2: 10308160 bytes, 36206672 total - age 3: 16927792 bytes, 53134464 total - age 4: 13493608 bytes, 66628072 total - age 5: 14301832 bytes, 80929904 total - age 6: 10448408 bytes, 91378312 total - age 7: 11724056 bytes, 103102368 total - age 8: 12299528 bytes, 115401896 total : 1807957K->147911K(1887488K), 0.1664510 secs] 5214984K->3554938K(6081792K) icms_dc=0 , 0.1671290 secs] [Times: user=0.61 sys=0.00, real=0.17 secs] 14251.429: [GC 14251.430: [ParNew Desired survivor size 107347968 bytes, new threshold 7 (max 8) - age 1: 25749296 bytes, 25749296 total - age 2: 20111888 bytes, 45861184 total - age 3: 7580776 bytes, 53441960 total - age 4: 16819072 bytes, 70261032 total - age 5: 13209968 bytes, 83471000 total - age 6: 14088856 bytes, 97559856 total - age 7: 10371160 bytes, 107931016 total - age 8: 11426712 bytes, 119357728 total : 1825735K->155304K(1887488K), 0.1888880 secs] 5232762K->3574222K(6081792K) icms_dc=0 , 0.1895340 secs] [Times: user=0.74 sys=0.06, real=0.19 secs] 14291.342: [GC 14291.343: [ParNew Desired survivor size 107347968 bytes, new threshold 7 (max 8) - age 1: 25786480 bytes, 25786480 total - age 2: 21991848 bytes, 47778328 total - age 3: 16650000 bytes, 64428328 total - age 4: 7387368 bytes, 71815696 total - age 5: 16777584 bytes, 88593280 total - age 6: 13098856 bytes, 101692136 total - age 7: 14029704 bytes, 115721840 total : 1833128K->151603K(1887488K), 0.1941170 secs] 5252046K->3591384K(6081792K) icms_dc=0 , 0.1947390 secs] [Times: user=0.82 sys=0.04, real=0.20 secs] 14334.142: [GC 14334.143: [ParNew Desired survivor size 107347968 bytes, new threshold 6 (max 8) - age 1: 31541800 bytes, 31541800 total - age 2: 20826888 bytes, 52368688 total - age 3: 19155264 bytes, 71523952 total - age 4: 16422240 bytes, 87946192 total - age 5: 7235616 bytes, 95181808 total - age 6: 16549000 bytes, 111730808 total - age 7: 13026064 bytes, 124756872 total : 1829427K->167467K(1887488K), 0.1890190 secs] 5269208K->3620753K(6081792K) icms_dc=0 , 0.1896630 secs] [Times: user=0.80 sys=0.03, real=0.19 secs] 14359.317: [Full GC 14359.317: [CMS: 3453285K->3099828K(4194304K), 13.1778420 secs] 4506618K->3099828K(6081792K), [CMS Perm : 261951K->181304K(264372K)] icms_dc=0 , 13.1786310 secs] [Times: user=13.15 sys=0.04, real=13.18 secs] 14373.287: [GC [1 CMS-initial-mark: 3099828K(4194304K)] 3100094K(6081792K), 0.0107380 secs] [Times: user=0.01 sys=0.00, real=0.00 secs] 14373.298: [CMS-concurrent-mark-start] 14472.579: [GC 14472.579: [ParNew Desired survivor size 107347968 bytes, new threshold 8 (max 8) - age 1: 42849392 bytes, 42849392 total : 1677824K->86719K(1887488K), 0.1056680 secs] 4777652K->3186547K(6081792K) icms_dc=0 , 0.1063280 secs] [Times: user=0.61 sys=0.00, real=0.11 secs] 14506.980: [GC 14506.980: [ParNew Desired survivor size 107347968 bytes, new threshold 8 (max 8) - age 1: 42002904 bytes, 42002904 total - age 2: 35733928 bytes, 77736832 total : 1764543K->96136K(1887488K), 0.0982790 secs] 4864371K->3195964K(6081792K) icms_dc=0 , 0.0988960 secs] [Times: user=0.53 sys=0.01, real=0.10 secs] 14544.285: [GC 14544.286: [ParNew Desired survivor size 107347968 bytes, new threshold 8 (max 8) - age 1: 26159736 bytes, 26159736 total - age 2: 37842840 bytes, 64002576 total - age 3: 33192784 bytes, 97195360 total : 1773960K->130799K(1887488K), 0.1208590 secs] 4873788K->3230628K(6081792K) icms_dc=0 , 0.1215900 secs] [Times: user=0.59 sys=0.02, real=0.13 secs] 14589.266: [GC 14589.266: [ParNew Desired survivor size 107347968 bytes, new threshold 4 (max 8) - age 1: 28010360 bytes, 28010360 total - age 2: 21136704 bytes, 49147064 total - age 3: 35081376 bytes, 84228440 total - age 4: 32468056 bytes, 116696496 total : 1808623K->148284K(1887488K), 0.1423150 secs] 4908452K->3248112K(6081792K) icms_dc=0 , 0.1429440 secs] [Times: user=0.70 sys=0.02, real=0.14 secs] 14630.947: [GC 14630.947: [ParNew Desired survivor size 107347968 bytes, new threshold 8 (max 8) - age 1: 28248240 bytes, 28248240 total - age 2: 20712320 bytes, 48960560 total - age 3: 18217168 bytes, 67177728 total - age 4: 34834832 bytes, 102012560 total : 1826108K->140347K(1887488K), 0.1784680 secs] 4925936K->3275469K(6081792K) icms_dc=0 , 0.1790920 secs] [Times: user=0.98 sys=0.03, real=0.18 secs] 14664.779: [GC 14664.779: [ParNew Desired survivor size 107347968 bytes, new threshold 5 (max 8) - age 1: 25841000 bytes, 25841000 total - age 2: 22264960 bytes, 48105960 total - age 3: 17730104 bytes, 65836064 total - age 4: 17988048 bytes, 83824112 total - age 5: 34739384 bytes, 118563496 total : 1818171K->147603K(1887488K), 0.1714160 secs] 4953293K->3282725K(6081792K) icms_dc=0 , 0.1720530 secs] [Times: user=0.82 sys=0.11, real=0.17 secs] 14702.488: [GC 14702.489: [ParNew Desired survivor size 107347968 bytes, new threshold 8 (max 8) - age 1: 26887368 bytes, 26887368 total - age 2: 21403352 bytes, 48290720 total - age 3: 18732224 bytes, 67022944 total - age 4: 17640576 bytes, 84663520 total - age 5: 17942952 bytes, 102606472 total : 1825427K->142695K(1887488K), 0.2118320 secs] 4960549K->3312168K(6081792K) icms_dc=0 , 0.2124630 secs] [Times: user=1.13 sys=0.14, real=0.21 secs]The strategy I was aiming at: I want to limit to the minimum what gets Tenured, I'm serving requests and expect that beyond a certain amount of shared objects, every other objects are useful only to the request at hand. Therefore by using a big NewSize and an increased TenuringThreshold and was hoping to have none of these single serving objects stick around.
The following are there to support my strategy:
-Xms=6G
-Xmx=6G
-XX:NewSize=2G // big space so that ParNew doesn't occur to often and let time for objects to expire
-XX:MaxTenuringThreshold=8 // to limit the tenuring some more
-XX:SurvivorRatio=7 // based on examples -XX:CMSInitiatingOccupancyFraction=60
// to prevent a Full GC caused by promotion allocation failed
-XX:+UseCMSInitiatingOccupancyOnly
// to go with the one above based on exampleMaxPermSize=1G and "-Dsun.reflect.inflationThreshold=0" are related to another issue I'd rather keep separated.
"-XX:+CMSClassUnloadingEnabled" and "-XX:+CMSPermGenSweepingEnabled" are there because of grails which rely heavily and extra classes for closures and reflexion
-XX:+CMSIncrementalMode is an experiment which hasn't yield much success
-
DNA about 12 yearsHow many processors do you have?
-
Kalisen about 12 yearsRunning jdk1.6.0_07, 16 procs, 32GB of RAM
-
Matt about 12 yearswhy did you pick the switches you're using?
-
Kalisen about 12 yearsThe strategy I was aiming at (see above for more details): I want to limit to the minimum what gets Tenured, I'm serving requests and expect that beyond a certain amount of shared objects, every other objects are useful only to the request at hand. Therefore by using a big NewSize and an increased TenuringThreshold and was hoping to have none of these single serving objects stick around.
-
-
Kalisen about 12 yearsThere's work done in parallel to find obvious sources of garbage. I'm trying to work with the current application.
-
Kalisen about 12 yearsRunning jdk1.6.0_07, 16 procs, 32GB of RAM. Point taken regarding IncrementalMode. My goal with -XX:CMSInitiatingOccupancyFraction was to make sure that there would be enough space in the Old Gen in case the entire NewGen happens to be promoted. Point taken for 3) I started with NewSize=512m but considering the rate at which objects where created, there was little impact of increasing the NewGen. I tried 1G as well which clearly reduced the amount of tenuring so I pushed to 2G to see if the trend would continue in favor of my strategy
-
Kalisen about 12 yearsMy main goal is to avoid long 10s+ blocking GC, I believe I can live with a certain amount of GC noise as long as it's in parallel. But I want do to a bit more testing to make sure of that. It does always recover. The load varies across the day with sustained spikes of several hours
-
Vladimir Sitnikov about 12 yearsDid you try upgrading to 1.6.0u26 or higher? It uses (since u23) compressedoops by default, so less memory would be wasted due to 64bit pointers
-
Matt about 12 yearswhat you need to do is establish how long those objects (that are bleeding into tenured) really live for? you also need to work out whether there are significant links between objects in the 2 generations? your current strategy seems a reasonable one but it may be untenable without a markedly bigger heap. If you can upgrade to get access to
compressedoopsthen you definitely should (as a 6G heap without it is really more like a 3-4G heap), either way you should consider ramping up the heap size so you can work out what the steady state really looks like. -
 Andrew Barber over 11 yearsI've removed the link to your website; it does not seem to contain any information addressing the question being asked here. Adding it makes your post seem like spam.