Getting error "Get http://localhost:9443/metrics: dial tcp 127.0.0.1:9443: connect: connection refused"
Solution 1
Your prometheus container isn't running on host network. It's running on its own bridge (the one created by docker-compose). Therefore the scrape config for peer should point at the IP of the peer container.
Recommended way of solving this:
- Run prometheus and grafana in the same network as the fabric network. In you docker-compose for prometheus stack you can reference it like this:
networks:
  default:
    external:
      name: <your-hyperledger-network>
(use docker network ls to find the network name )
Then you can use http://<peer_container_name>:9443 in your scrape config
Solution 2
Since the targets are not running inside the prometheus container, they cannot be accessed through localhost. You need to access them through the host private IP or by replacing localhost with docker.for.mac.localhost or host.docker.internal.
Solution 3
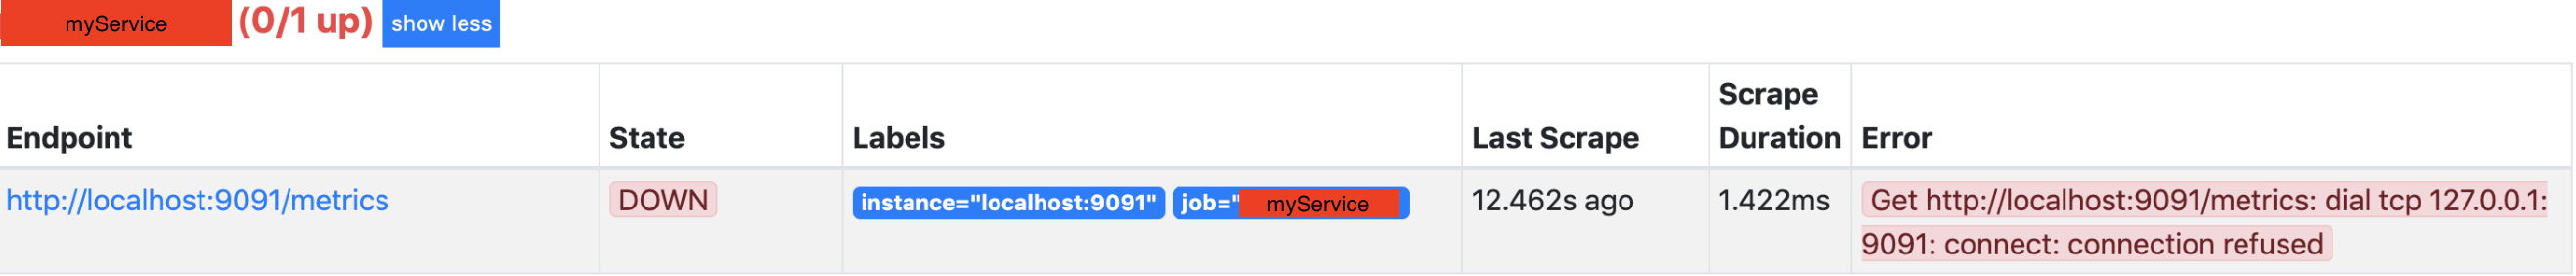
The problem: On Prometheus you added a service for scraping but on http://localhost:9090/targets the endpoint state is Down
with an error:
Get http://localhost:9091/metrics: dial tcp 127.0.0.1:9091: connect: connection refused
Solution: On prometheus.yml you need to verify that
- scraping details pointing to the right endpoint.
- the yml indentation is correct.
- using
curl -v http://<serviceip>:<port>/metricsshould prompt the metrics in plaintext in your terminal.
Note: If you pointing to some service in another docker container, your localhost might be represented not as localhost but as servicename ( service name that shown in docker ps ) or docker.host.internal (the internal ip that running the docker container ).
for this example: I'll be working with 2 dockers containers prometheus and "myService".
sudo docker ps
CONTAINER ID        IMAGE                     CREATED                        PORTS                    NAMES
abc123        prom/prometheus:latest        2 hours ago               0.0.0.0:9090->9090/tcp         prometheus
def456        myService/myService:latest         2 hours ago               0.0.0.0:9091->9091/tcp         myService
and then edit the file prometheus.yml (and rerun prometheus)
- job_name: myService
  scrape_interval: 15s
  scrape_timeout: 10s
  metrics_path: /metrics
  static_configs:
    - targets: // Presenting you 3 options
      - localhost:9091 // simple localhost
      - docker.host.internal:9091 // the localhost of agent that runs the docker container
      - myService:9091 // docker container name (worked in my case)
Related videos on Youtube
 06 : 18
 03 : 23
Kartik Chauhan
Updated on July 09, 2022Comments
-
 Kartik Chauhan 6 months
I'm trying to configure Prometheus and Grafana with my Hyperledger fabric v1.4 network to analyze the peer and chaincode mertics. I've mapped peer container's port
9443to my host machine's port9443after following this documentation. I've also changed theproviderentry toprometheusundermetricssection incore.ymlof peer. I've configured prometheus and grafana indocker-compose.ymlin the following way.prometheus: image: prom/prometheus:v2.6.1 container_name: prometheus volumes: - ./prometheus/:/etc/prometheus/ - prometheus_data:/prometheus command: - '--config.file=/etc/prometheus/prometheus.yml' - '--storage.tsdb.path=/prometheus' - '--web.console.libraries=/etc/prometheus/console_libraries' - '--web.console.templates=/etc/prometheus/consoles' - '--storage.tsdb.retention=200h' - '--web.enable-lifecycle' restart: unless-stopped ports: - 9090:9090 networks: - basic labels: org.label-schema.group: "monitoring" grafana: image: grafana/grafana:5.4.3 container_name: grafana volumes: - grafana_data:/var/lib/grafana - ./grafana/datasources:/etc/grafana/datasources - ./grafana/dashboards:/etc/grafana/dashboards - ./grafana/setup.sh:/setup.sh entrypoint: /setup.sh environment: - GF_SECURITY_ADMIN_USER={ADMIN_USER} - GF_SECURITY_ADMIN_PASSWORD={ADMIN_PASS} - GF_USERS_ALLOW_SIGN_UP=false restart: unless-stopped ports: - 3000:3000 networks: - basic labels: org.label-schema.group: "monitoring"When I
curl 0.0.0.0:9443/metricson my remote centos machine, I get all the list of metrics. However, when I run Prometheus with the above configuration, it throws the errorGet http://localhost:9443/metrics: dial tcp 127.0.0.1:9443: connect: connection refused. This is what myprometheus.ymllooks like.global: scrape_interval: 15s evaluation_interval: 15s scrape_configs: - job_name: 'prometheus' scrape_interval: 10s static_configs: - targets: ['localhost:9090'] - job_name: 'peer_metrics' scrape_interval: 10s static_configs: - targets: ['localhost:9443']Even, when I go to endpoint
http://localhost:9443/metricsin my browser, I get all the metrics. What am I doing wrong here. How come Prometheus metrics are being shown on its interface and not peer's? -
Kartik Chauhan almost 4 yearsI've added prometheus and grafana configuration in docker-compose.yml itself. i added networks: basic: driver: bridge at the top. Prometheus is working fine. The targets are up when seen on the prometheus interface. However when I'm adding datasource localhost:9443 in grafana, it says HTTP Bad error Gateway.
-
Kartik Chauhan almost 4 yearsUpon adding networks: default: external: name: basic in docker-compose.yml, I'm getting errror 'Network basic declared as external, but could not be found. Please create the network manually using
docker network create basicand try again.' -
Kartik Chauhan almost 4 yearsOn inspecting network by doing docker network inspect <network-name>, I can see prometheus and grafana containers part of the same network as other fabric containers are.
-
R Thatcher almost 4 yearsThe network used by the "basic-network" sample fabric is called "net_basic" (rather than "basic").
-
 antweiss almost 4 years@KartikChauhan, if they are on the same network, then again - you need to scrape not on the localhost but on peer container service name.
 -
antweiss almost 4 years@KartikChauhan in Grafana you should be adding only the prometheus as data source - i.e prometheus:9090
-
Kartik Chauhan almost 4 years@antweiss Yes, I'm doing exactly what you said here I've added this in prometheus.yml - job_name: 'peer_metrics' scrape_interval: 10s static_configs: - targets: ['peer0.org1.example.com:9443'] I'm getting the targets up in prometheus interface but when I create datasource with url http:localhost:9090 in grafana, I don't see any graph for peer or chaincode.
-
antweiss almost 4 years@KartikChauhan what's the query you're using in Grafana?
-
Kartik Chauhan almost 4 yearsOkay okay, I got it now, I had to import the dashboard in order to see the graphs.
-
Kartik Chauhan almost 4 years@antweiss Just one more favor, could you tell how can i import the dashboard used on this page these guys jira.hyperledger.org/browse/FAB-12872?attachmentSortBy=dateTime. Please have a look at the screenshot. I couldn't find this one in grafana available dashboards.
-
antweiss almost 4 years@KartikChauhan as far as I can tell - there is no dashboard to import there. You'll have to create your own dashboards by inputting prometheus queries for the metrics you're interested in. Something like :
ledger_blockchain_height(channel="mychannel", instance="peer0.org1.example.com:9443") -
user_dev almost 2 yearsOn Linux - myService:9090 could be the preferred way
-
 Datz over 1 yearyou should use only
host.docker.internal.docker.for.mac.localhostanddocker.for.win.localhostare deprecated. -
 Promise Preston 7 monthsThanks. docker container name worked for me
 -
 Pavel 6 months
host.docker.internalandcontainer nameworked for me