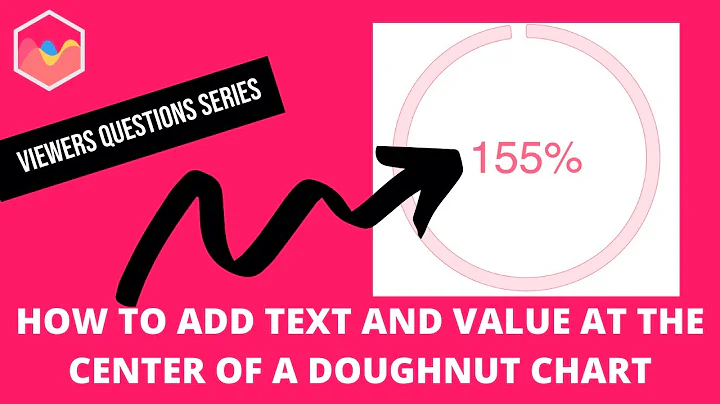
Half Doughnut Chart with Chart.js
Solution 1
Original Answer:
I'm not sure there is a quick and simple solution to this.
Perhaps you can create a second pie chart directly on top of the existing one and have that pie chart only have circumference for a few pixels but rotated at at X percent, in this case 89%. A bit of Maths is required to work out where 89% of half a circle is. this won't give you a nice circle marker as per your image above. It will give you a small coloured segment where that circle marker ought to be and with the help of some css this second pie chart segment can be rounded off to look like what you want.
The second pie chart may look like this ...
var ctx2 = document.getElementById("dashboardChart2");
    var dashboardChart2 = new Chart(ctx2, {
        type: 'doughnut',
        data: {
            labels: ["Purple"],
            datasets: [{
                label: '# of Votes',
                data: [5],
                backgroundColor: [
                   'rgba(159, 90, 253, 1)'
                ],
                borderColor: [
                    'rgba(255, 255, 255 ,1)',
                ],
                borderWidth: 2
            }]

        },
        options: {
            rotation: 1 * Math.PI,/** This is where you need to work out where 89% is */
            circumference: 1 * Math.PI,/** put in a much smaller amount  so it does not take up an entire semi circle */
            legend: {
                display: false
            },
            tooltip: {
                enabled: false
            },
            cutoutPercentage: 95
        }
    });
As for the large 89% that will probably involve css. Positioning the text directly 'infront' of the pie chart (involving things like z-index and position absolutely)
New Answer:
Perhaps you can create a doughnut chart directly on top of the existing one and have that doughnut chart have its first and third 'bars' with an opacity of 0 so they can not be seen. If the first bar has a value of 88.5 and the second bar has a value of 1 and the third bar has a value of 10.5 you will have effectively put the second bar at 89%, with a width of 1% (88.5 + 1 + 10.5 = 100).
datasets: [{
   data: [88.5, 1,10.5],// how much space each bar should take
   backgroundColor: [
      "rgba(0,0,0,0)", // bar 1: opacity 0
      "rgba(255,255,255,1)", // bar 2 is white
      "rgba(0,0,0,0)", // bar 3: opacity 0
   ],
   borderColor: [
      'rgba(0, 0, 0 ,0)',// bar 1 border opacity 0
      'rgba(46, 204, 113, 1)',// bar 2 border is green
      'rgba(0, 0, 0 ,0)'// bar 3 border opacity 0
   ],
   borderWidth: 3
}]
As for the large 89% that will probably involve css. Positioning the text directly 'infront' of the pie chart
.percent {
 position: absolute;
    left: 50%;
    transform: translate(-50%, 0);
    font-size: 80px;
    bottom: 0;
}
After having a go in a fiddle I have this ...

Example Here:
https://jsfiddle.net/rjtsbeLc/3/
Note that with relative and absolute positioning I have placed the second doughnut chart on top of the existing one, and the percentage text on top of them at the bottom in the centre.
.outer {
  position: relative;
  width: 600px;
  height: 400px;
}
canvas {
  position: absolute;
}
It isn't quite what you are looking for as the 'circle' is rectangular but I came accross this, it might help you work out how to round off the rectangle into a circle ...
Chart.js Doughnut with rounded edges https://stackoverflow.com/a/36964890/5178301
Solution 2
To get you started, I was able to get a half-doughnut, or how I call it, a speedometer graph, using the following options configuration:
var chart = new Chart(canvas, {
  type: 'doughnut',
  data: ['400', '200'],
  options: {
    rotation: -90,
    circumference: 180,
}
chartjs version 3.5.1
Related videos on Youtube
 40 : 21
 45 : 11
 21 : 05
 03 : 58
 02 : 00
 07 : 46
 19 : 28
 02 : 22
Nick
Updated on November 24, 2021Comments
-
Nick over 2 years
Is there anyway to implement an animated indicator for chart.js doughnut charts? What I am looking to accomplish looks like this:

I've got the doughnut part of the chart complete, but can't seem to find a way to add the value (large text: 89% (dynamic)) or the dot for the indicator.
The code i've used is the following:
HTML
<canvas id="dashboardChart" width="400" height="400"></canvas>JS
var ctx = document.getElementById("dashboardChart");
    var dashboardChart = new Chart(ctx, {
        type: 'doughnut',
        data: {
            labels: ["Red", "Orange", "Green"],
            datasets: [{
                label: '# of Votes',
                data: [33, 33, 33],
                backgroundColor: [
                    'rgba(231, 76, 60, 1)',
                    'rgba(255, 164, 46, 1)',
                    'rgba(46, 204, 113, 1)'
                ],
                borderColor: [
                    'rgba(255, 255, 255 ,1)',
                    'rgba(255, 255, 255 ,1)',
                    'rgba(255, 255, 255 ,1)'
                ],
                borderWidth: 5
            }]

        },
        options: {
            rotation: 1 * Math.PI,
            circumference: 1 * Math.PI,
            legend: {
                display: false
            },
            tooltip: {
                enabled: false
            },
            cutoutPercentage: 95
        }
    });
Any help is greatly appreciated!
-
Nick almost 5 yearsI'm not sure I follow this entirely. Is it possible to put it in a snippet to preview it?
-
 Carlene almost 5 years@Nick I have added to my original answer hop this helps :)