High System Load, Low CPU/RAM Utilization on Ubuntu 15.04
This ended up being what I believe to be a kernel bug. Upon updating to 4.0.0-040000-generic #201504121935 my CPU wait has been normal and system load under .10 in most cases unless something is happening on the hosted servers.
Anyway, I used the following link to help : http://ubuntuhandbook.org/index.php/2015/04/upgrade-to-linux-kernel-4-0-in-ubuntu/
and just to keep in compliance with the rules, I did the following as root and then rebooted the machine:
wget http://kernel.ubuntu.com/~kernel-ppa/mainline/v4.0-vivid/linux-headers-4.0.0-040000_4.0.0-040000.201504121935_all.deb
wget http://kernel.ubuntu.com/~kernel-ppa/mainline/v4.0-vivid/linux-image-4.0.0-040000-generic_4.0.0-040000.201504121935_amd64.deb
wget http://kernel.ubuntu.com/~kernel-ppa/mainline/v4.0-vivid/linux-headers-4.0.0-040000-generic_4.0.0-040000.201504121935_amd64.deb
dpkg -i linux-headers-4.0.0*.deb linux-image-4.0.0*.deb
update-grub
As far as how I came to this - after reading through countless forums and newsgroups/mailing lists and getting nowhere (tried messing with BIOs, boot options, commit=60, disabling services, changing physical server location, etc.) I decided to either downgrade or update the kernel...being that 15.04 is new I updated. Still unsure the root cause as I haven't seen any other reports of this issue, my assumption is when I used rsync from my old 14.10 system a faulty driver was copied over or a faulty kernel file - why 4.0.0 fixes this is beyond me...but at least no more kworker writing every 5 seconds to kern.log and my harddrives.
Related videos on Youtube
 07 : 01
 07 : 46
 20 : 00
 07 : 14
 28 : 29
 07 : 21
 02 : 26
 07 : 25
eric
Updated on September 18, 2022Comments
-
eric over 1 year
not really a system administrator here but really trying to just set up a server (a rented VDS, really) for some friends.
I recently transferred basically game servers/MySQL/web sites over from one VPS to another - while there hasn't been any issues on the new one I keep seeing my system load spike and take up both processors; previous server system load averaged at about .3-.5. Previous server was on Ubuntu 14, I exported a list of packages I installed from there and apt-get installed them on the new server; I also rsync'd most of the files from the old server over as well (I'm thinking I copied over something bad that's messing with my kernel...)
Anyway, here is the results of my uname -a:
Linux ophq 3.19.0-18-generic #18-Ubuntu SMP Tue May 19 18:31:35 UTC 2015 x86_64 x86_64 x86_64 GNU/LinuxAnd the results of landscape-sysinfo/logging in screen:
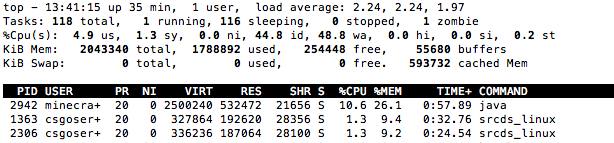
  Welcome to Ubuntu 15.04 (GNU/Linux 3.19.0-18-generic x86_64)
  System load:  2.13                Processes:           11
  Usage of /:   22.6% of 196.64GB   Users logged in:     1
  Memory usage: 32%                 IP address for eth0: 123.123.123.123
  Swap usage:   0%
(currently one game server is in use hence the memory usage - I have to reduce how much RAM is allocated to Minecraft from the default values)
Result of top: http://ericbarber.me/serverproblem/top.png
To add to this - if I hit F and then hit S on 'Process Status' and resort the top lists I have 2 commands listed under 'D'... kworker/u30:0 and kworker/u30:1 which leads me to my kernel assumption...
I'm totally stumped on why load average is so high - I had my users test on both MC and the CS:GO servers and they aren't experiencing any lag - I also tested the web servers and they're delivering pages extremely fast (in comparison to the old server.)
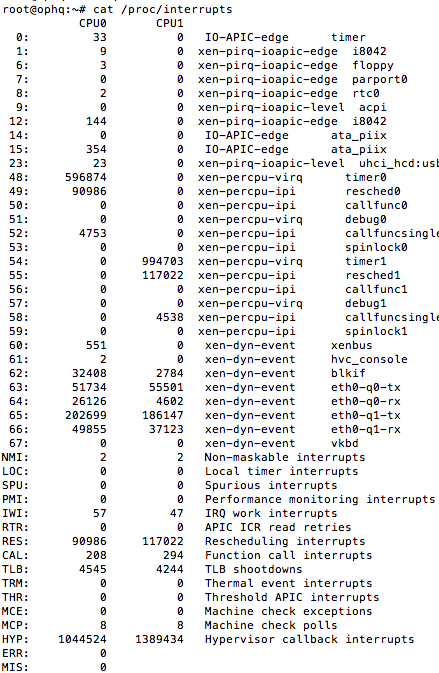
I thought it may be an interrupt issue, so here's the results of cat /proc/interrupts:
http://ericbarber.me/serverproblem/interrupts2.png
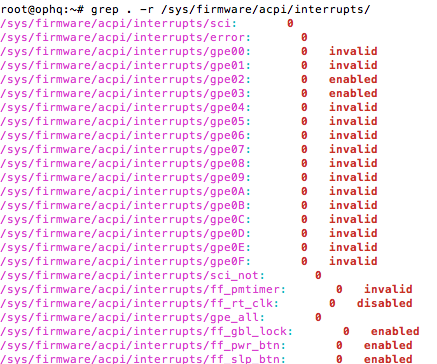
Along with this, another question suggested running grep . -r /sys/firmware/acpi/interrupts/ and disabling any values above 0...although all my values are 0 unfortunately.
same url as above serverproblem/interrupts.png
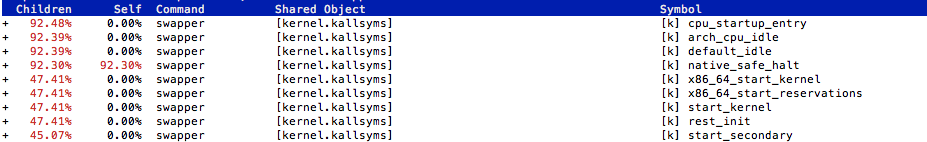
I installed perf and did a quick 30 second report - but I don't understand this output too much:
same url as above serverproblem/perf.png
I'll omit CPU info, but it is an Intel Xeon CPU E5-2690, 2 cores, 2gb RAM, and I believe about 500gb harddrive. My apologies if this is a dumb question or has been asked before - I've been working on this for a few hours now and I'm running into dead-ends with Google past just starting over from scratch...which preferably I would like to avoid.
Apologies on the links..new user limitations.
Edit: To add, the results of mpstat:
Linux 3.19.0-18-generic (ophq) 06/05/2015 _x86_64_ (2 CPU) 02:10:35 PM CPU %usr %nice %sys %iowait %irq %soft %steal %guest %gnice %idle 02:10:35 PM all 7.28 0.00 1.72 47.13 0.00 0.09 0.53 0.00 0.00 43.24-
eric almost 9 yearsjust to have those links clickable: ericbarber.me/serverproblem/perf.png and ericbarber.me/serverproblem/interrupts.png
-
-
eric almost 9 yearsActually, after sitting on the iotop screen for a few minutes eventually kworker did bubble up to 99.99% IO on both CPU cores (I'm assuming both cores.. [kworker/u30:0] and [kworker/u31:0] are the culprit. I exited and ran another perf - saw your post, checked iotop and it was gone, haha.
-
eric almost 9 yearsUnfortunately my host moved to a new box and we still see the same issue - however, no performance issues over the weekend...it really seems like a 2 is just being appended to the actual load - but that doesn't make sense as kworker still sits at 99.99% occasionally. I think this may have something to do with the fact that originally I rsync'd from another server (excluding most of the OS specific directories however) - maybe a driver conflict somewhere along the way...