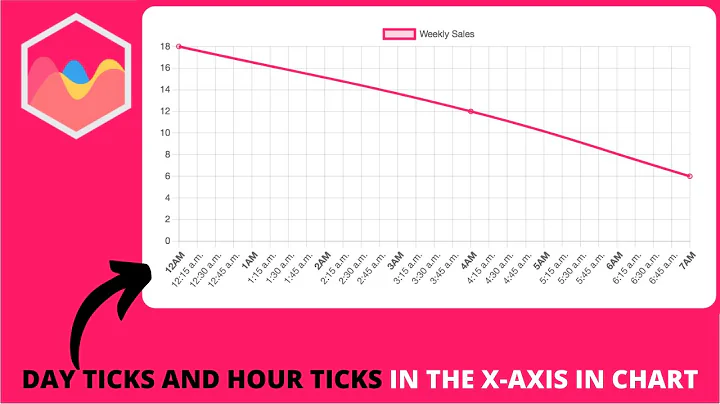
Highcharts chart with 'datetime' xAxis - use categories on drilldown
Solution 1
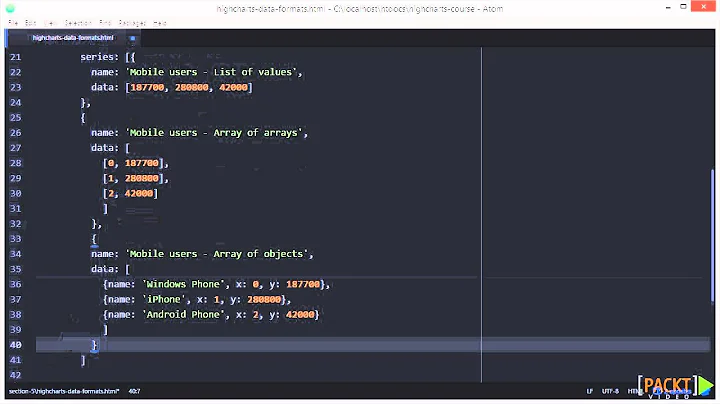
I have found a solution for your problem! Sebastian Bochan gave me some ideas. You need to separate xAxis and set a different type to each one. So, here you have to add your categories as Highcharts's way.
xAxis: [{
         id: 0,
         type: 'datetime'
       },
       {
         id: 1,
         type: 'categories',
         categories: data.categories
       }
   ]
Then you have to add this code in your serie to link it with your new Axis.
drilldown: {
      series: [{
        name: "test",
        id: "test",
        xAxis: 1, // <--- your desired X axis ID
        data: [
          [your data]
        ]
      }]
    }
Probably you'll see a small difference on bottom chart, but all works for me.
I hope this help to you ;)
Solution 2
You need to add this to your xAxis:
labels: {
        formatter: function() {
              return Highcharts.dateFormat('%a %d %b', this.value);
         }
},
Check out the fiddle.
Related videos on Youtube
 13 : 31
 01 : 58
 12 : 25
 12 : 37
 03 : 56
 02 : 48
 05 : 29
 09 : 36
 19 : 30
 01 : 02
 01 : 02
chevin99
Updated on September 15, 2022Comments
-
chevin99 over 1 year
Is there a way to have 'datetime' for the xAxis type on the main series, but then when a series is clicked on, have the drilldown use categories for that time?
In this jsfiddle example (http://jsfiddle.net/kadams/3e3xqv7e/), you can see that when 'category' is used as the xAxis type, the drilldown data correctly uses the drilldown series names 'A', 'B', and 'C' on the xAxis. But when the xAxis type is changed to 'datetime', and and the millisecond time is used for the 'x' value in place of a name for the main series, the categories on the drilldown don't show 'A', 'B', or 'C' anymore. Just meaningless dates.
UPDATE for clarification - I would prefer to use the 'datetime' type instead of 'category' type with values formatted as dates, because Highcharts will throw the 'too many ticks' error when the x-axis is big: http://www.highcharts.com/errors/19. I give the 'category' type example in the fiddle below simply to demonstrate that 'A', 'B', 'C' do show properly when the type is not 'datetime'.
$(function () {
    $('#container').highcharts({
        chart: {
            type: 'column',
        },
        xAxis: {
            type: 'category',
            //  type: 'datetime',
            dateTimeLabelFormats: {
                hour: '%l:%M %p'
            }
        },
        legend: {
            enabled: false
        },
        series: [{
            name: 'Total',
            colorByPoint: true,
            data: [{
                y: 8,
                drilldown: 'Bob',
                name: 'Bob', //used with 'category' xAxis type
                x: 1420700400000 //used with 'datetime' xAxis type
            }]
        }],
        drilldown: {
            series: [{
                id: 'Bob',
                name: 'Bob',
                data: [{
                    name: 'A',
                    y: 3
                }, {
                    name: 'B',
                    y: 3
                }, {
                    name: 'C',
                    y: 2
                }]
            }]
        }
    });
});