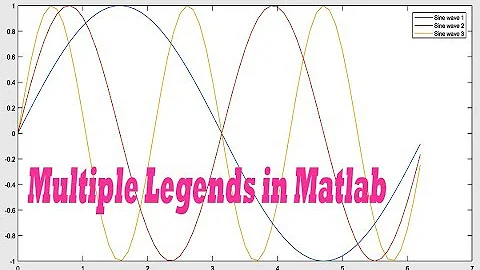
How can I add a 2-column legend to a Matlab plot?
Solution 1
MATLAB has introduced native support for multiple columns in legend from version 2018a. Just add 'NumColumns',desired_number at the end of the legend() command.
See details here - https://www.mathworks.com/help/matlab/ref/legend.html?lang=en&s_tid=gn_loc_drop#bt6r30y
Additionally, the orientation of the legend entries can be changed from top-to-bottom to left-to-right.
By default, the legend orders the items from top to bottom along each column. To order the items from left to right along each row instead, set the Orientation property to 'horizontal'.
Solution 2
You can usually hack this sort of thing by making a second invisible axis on top of the first, like this:
t=0:.01:(2*pi);
y=[sin(t);sin(t-pi/12);sin(t-pi/6);sin(t-pi/4)];
figure
subplot(6,1,5)

plot(t,y)
xlim([0 2*pi])
l1 = legend('1', '2');
pos = l1.Position;
set(l1, 'Position', pos - [pos(3) 0 0 0]);
legend boxoff

ax2 = copyobj(gca, gcf);
set(ax2, 'visible', 'off', 'clipping', 'off')
kids = ax2.Children;
set(kids, 'visible', 'off', 'clipping', 'off')
set(ax2, 'children', kids([3:4 1:2]))
l2 = legend(ax2, '3', '4');
legend(ax2, 'boxoff')
legend boxoff
Note that this is fragile (e.g., doesn't handle the window being resized on my version of MATLAB).
Related videos on Youtube
 07 : 30
 06 : 16
 07 : 25
 16 : 57
 03 : 06
 03 : 06
Comments
-
Karlo almost 2 years
Consider following code:
t=0:.01:(2*pi);
y=[sin(t);sin(t-pi/12);sin(t-pi/6);sin(t-pi/4)];
figure(1)
    clf
    subplot(6,1,5)
    plot(t,y)
    xlim([0 2*pi])
    legend('1','2','3','4')
It produces following figure:

Is there a way to change the legend to a 2-column lay-out? So it would be
--- 1 --- 3
--- 2 --- 4
instead of
--- 1
--- 2
--- 3
--- 4
so the legend boundary lined would not cross the graph boundary lines.
I found the
gridLegendscript, but I prefer to code it directly.-
 Ander Biguri almost 8 yearsNot sure if you can with orthodox methods but really interesting question. Probably someone can hack into java and do it. Probably
gridLegendis best -
sco1 almost 8 yearsIf you want to code it directly then follow along with what
gridLegendis doing and implement it yourself. -
nirvana-msu almost 8 yearsI would advise to simply use
gridLegend. There's really no point re-inventing the wheel. -
Matt almost 8 yearsWhat about
legend('1','2','3','4','Orientation','horizontal')so the legend doesn't cross the border of the axes? This might not solve your question but could be a straight-forward solution to your problem. -
optimist almost 8 yearsOther than gridlegend there's also columnlegend: mathworks.com/matlabcentral/fileexchange/27389-columnlegend
-
-
Karlo over 7 yearsInteresting hack. Could indeed be improved so the two legends are at the same height for each figure window size.