How can I find the total number of TCP connections for a given port and period of time by IP?
Solution 1
Turn on iptables and set it to LOG for incoming connections. Example rule:
-A INPUT --state NEW -p tcp --dport 4711 -j LOG
(where 4711 is the port you want to track).
Then run the resulting log through whatever script you like that can do the summary for you.
Solution 2
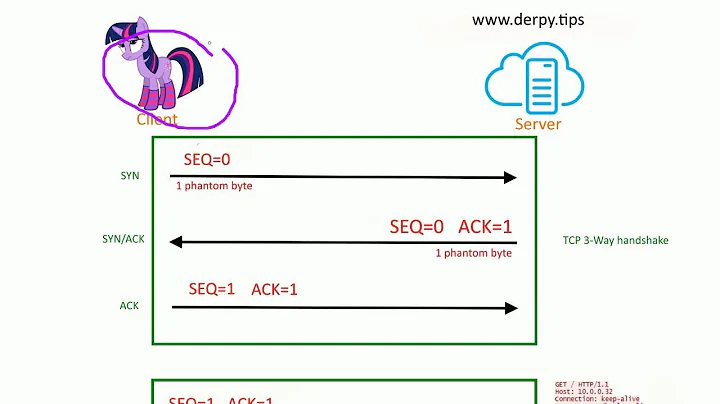
You can use tcpdump to log all SYN (without ACK) packets:
tcpdump "dst port 4711 and tcp[tcpflags] & (tcp-syn|tcp-ack) == tcp-syn"
or log all SYN+ACK packets (established connections):
tcpdump "src port 4711 and tcp[tcpflags] & (tcp-syn|tcp-ack) == (tcp-syn|tcp-ack)"
And then combine it with a wc -l to count all lines
You'd also need a way to measure fixed periods of time (you could have a cron just send it a SIGINT at regular intervals, tcpdump will count bytes and packets but only logs time)
Update: not necessary to say, have a look to the man page of tcpdump and consider using some options like: -i (listen to only one interface), -p (disable promiscuous mode; less invasive), or some output options. Tcpdump needs root permissions and your boss may not like it because it is kind of a hacker tool. On the other hand, you don't need to touch anything on your system to run it (in contrast to the iptables LOG solution)
Please also remark the small src/dsk difference in the filter. If you catch SYN+ACK packets and want to count connections to a server at port 4711 you need src. If you are catching SYN+!ACK packets for the same result, you need dst. If you count connections on the server itself, you always have to use the reverse.
Solution 3
SystemTap solution
Script inspired by the tcp_connections.stp example:
#!/usr/bin/env stap
# To monitor another TCP port run:
#     stap -G port=80 tcp_connections.stp
# or
#     ./tcp_connections.stp -G port=80
global port = 22
global connections

function report() {
  foreach (addr in connections) {
    printf("%s: %d\n", addr, @count(connections[addr]))
  }
}

probe end {
  printf("\n=== Summary ===\n")
  report()
}

probe kernel.function("tcp_accept").return?,
      kernel.function("inet_csk_accept").return? {
  sock = $return
  if (sock != 0) {
    local_port = inet_get_local_port(sock)
    if (local_port == port) {
      remote_addr = inet_get_ip_source(sock)
      connections[remote_addr] <<< 1
      printf("%s New connection from %s\n", ctime(gettimeofday_s()), remote_addr)
    }
  }
}
Output:
[root@bubu ~]# ./tcp_connections.stp -G port=80
Mon Mar 17 04:13:03 2014 New connection from 192.168.122.1
Mon Mar 17 04:13:04 2014 New connection from 192.168.122.1
Mon Mar 17 04:13:08 2014 New connection from 192.168.122.4
^C
=== Summary ===
192.168.122.1: 2
192.168.122.4: 1
strace solution
Either start the program under strace:
strace -r -f -e trace=accept -o /tmp/strace ${PROGRAM} ${ARGS}
or trace an already running program:
strace -r -f -e trace=accept -o /tmp/strace -p ${PID_OF_PROGRAM}
-r prints a relative timestamp upon entry to each system call in case it's needed later for extra performance analysis. -f traces child processes and it might not be needed.
The output looks something like this:
999        0.000000 accept(3, {sa_family=AF_INET, sin_port=htons(34702), sin_addr=inet_addr("192.168.122.4")}, [16]) = 5
999        0.008079 --- SIGCHLD (Child exited) @ 0 (0) ---
999        1.029846 accept(3, {sa_family=AF_INET, sin_port=htons(34703), sin_addr=inet_addr("192.168.122.4")}, [16]) = 5
999        0.008276 --- SIGCHLD (Child exited) @ 0 (0) ---
999        3.580122 accept(3, {sa_family=AF_INET, sin_port=htons(50114), sin_addr=inet_addr("192.168.122.1")}, [16]) = 5
and can be filtered with:
# gawk 'match($0, /^([0-9]+)[[:space:]]+([0-9.]+)[[:space:]]+accept\(.*htons\(([^)]+)\),.*inet_addr\("([^"]+)"\).*[[:space:]]+=[[:space:]]+([1-9][0-9]*)/, m) {connections[m[4]]++} END {for (addr in connections) printf("%s: %d\n", addr, connections[addr]); }' /tmp/strace
192.168.122.4: 3
192.168.122.1: 2
Short explanation of the AKW one-liner: m[1] is the PID, m[2] is the timestamp, m[3] is the remote port and m[4] is the remote address.
The advantage of this solution is that root is not required if the server runs under the same user. The disadvantage is that all connections are counted, there's no filtering, so it won't work if the application listens on multiple ports.
Solution 4
Your system won't remember counts of past connections unless you tell it to, so don't expect to find counters like you have for total traffic through an interface unless you set something up to do that counting.
Also, in general, you cannot reliably do this counting by polling, as Jacek Lakomiec suggested, as some connections will start and finish faster than your polling period. That sort of approach might be acceptable for some situations where you are sure that the time connections are made for will be long enough, but I can't think of good reasons to prefer it.
As suggested by Jenny D and Daniel Alder, your options for counting connections as they occur are basically firewall based counters and packet-capture based counters. Both will generally work well, although if your system is CPU constrained, you may fail to count some connections if you use the packet based approach, and also it's likely to consume more system resources to do the counting. On the other hand, packet capture based approaches can be simpler and safer to set up for ad-hoc investigations.
There is another general class of solution, which is netflow. It's more involved to set up, but if it's done right, it's particularly efficient, and if you are doing large-scale, or ongoing monitoring I'd look in this direction. Capturing the raw data can be done in your firewall (eg fprobe-ulo) or using libpcap which is slower (eg fprobeg). The capture system sends flow data via the network to a collector (eg nfdump), and you then have a variety of tools for analyzing that data (eg nfsen).
Some routers (particularly cisco gear) come with netflow capture, and it can also be configured into other routers via third party firmware, or of course you can run it on your linux system. If you wish, many collection points can forward their flow data to a single collector. You can find free software options at eg http://www.networkuptime.com/tools/netflow/, and there are also many commercial offerings.
Netflow is designed for industrial scale use, but I've found it very serviceable for collecting data on use of my home network in a share-house so that I can identify who or what is responsible when traffic usage is higher than expected.
Be careful any time you're messing with firewall rules on a remote server, and in general I'd recommend finding a good front end to configure your firewall rather than issuing iptables commands directly. (I like ferm, but there are many good ones).
One other thing to think about - sometimes you don't want to do this at the network layer at all. Sometimes it's appropriate to monitor the daemon process's system calls with strace or similar. It's CPU intensive, and be careful of slowing down the Daemon process, but in some circumstances, it can be appropriate, depending mostly on what other info you need to gather at the same time, or perhaps if you need to isolate a single forked child of the daemon.
Solution 5
So far the solution that worked best for me was to just grab the contents of /proc/net/ip_conntrack every 20 seconds, log that into a file with file name containing appropriate timestamp and using those as input to any of the filtering scripts, or even oneliners when necessary. To save you time you can use my script. I use crontab entries to make sure the script is ran every minute (it lasts for 60 seconds in the current configuration, feel free to modify it :-)
 cat conn_minute.sh
#!/bin/bash

function save_log {
LOG_DIR=/mnt/logs/ip_conntrack/`date +%Y%m%d`
TEMP_FILE=$LOG_DIR/`date +%Y%m%d_%H%M%S`.gz
LOG_FILE=$LOG_DIR/`date +%Y%m%d_%H`.tar
if [ ! -d $LOG_DIR ]
then
    mkdir $LOG_DIR
fi
gzip -c /proc/net/ip_conntrack > $TEMP_FILE
if [ -f $LOG_FILE ]; then
    tar -rf $LOG_FILE $TEMP_FILE 2> /dev/null
else
    tar -cf $LOG_FILE $TEMP_FILE 2> /dev/null
fi
rm $TEMP_FILE
}
function log_minute {
i=1;
LOOP_COUNTER=3
LOOP_TIME=20
while [ $i -le $LOOP_COUNTER ]; do
    save_log
    i=$[i+1]
    sleep $LOOP_TIME
done
}

log_minute
You can adjust how often you want to dump the content of ip_conntrack by changing LOOP_COUNTER and LOOP_TIME accordingly. So to get it every 5 secs, it would be: LOOP_COUNTER=12 , LOOP_TIME=5. LOG_DIR is imply where the logs would be saved to.
Afterwards you can use zcat to cat files you're interested in and use grep to filter source IPs/ports of your interest (or just use zgrep). grep -c will count whatever you're after. You can also use grep src=1.2.3.4 | grep dport=63793 | sort | uniq | wc -l.
Related videos on Youtube
 07 : 55
 15 : 12
 14 : 28
 05 : 54
 05 : 30
Dave Forgac
Updated on September 18, 2022Comments
-
Dave Forgac over 1 year
On a Linux system there are plenty of methods for listing the current TCP connections for a given port by connecting IP but: how can I count the total number of connections to a port per source IP for period of time?
-
Mxx about 10 yearsWhat period of time are you talking about? Last 5min or long term(months/years)?
-
Dave Forgac about 10 yearsIt's something I'd like to watch for a period of time while testing so connections while a program is running for n time.
-
-
quadruplebucky about 10 yearsIf I were going to use iptables for this I definitely wouldn't use "tcp" as the module for the -m flag. Even if it did exist, what would it possibly mean?
-
 Jenny D about 10 years@quadruplebucky It occasionally happens that people make a mistake when they type a command in. In which case, asking what they mean is a good thing, although it's better if it's done politely.
 -
Daniel Alder about 10 years@quadruplebucky: you were right: my description didn't match the command. but with your edit, established connections are counted twice, this is not what we want.
-
quadruplebucky about 10 years@DanielAdler I get seriously pissed off at bosses who call tcpdump and nmap "hacker tools", that's why I don't have them (bosses, not tools) anymore. Your point is well taken, but you can go ahead and log fins too and you'll still get a small integer to divide by in your roll-your-own ;) I was kind of intrigued by combinations of limit and connectiontrack in iptables, but really didn't spend too much time thinking about it. I'm still a pf kinda guy.
-
quadruplebucky about 10 yearsNot trying to be rude, I apologize. I just didn't understand what you did mean, as I say above, iptables is rarely my tool of choice.
-
quadruplebucky about 10 years@DanielAdler Your second example is syntactically wrong. It rejects everything that is a syn or an ack because it matches either side of the == and finds that condition to be a boolean truth. And it's wise to avoid the double quotes because you really might just be running on a sol8 box. And boxes send me syns all the time that don't grow up to be connections.
-
Daniel Alder about 10 years@quadruplebucky again wrong: the boolean syntax is correct, but there was something to change in the src/dst part of the filter
-
Daniel Alder about 10 years@quadruplebucky you really seem to want to change double quotes to single quotes. But consider: we are not speaking about shell environments. You might use a different shell on your Solaris machine, but also Solaris has a bash shell. If I change this thing, a Windows user will come and tell me that single quotes are not supported on his system. And then, I have to change back? So what's the real reason to insist on this banality? It would be better for you to carefully ready my name and don't write it with the typo next time...
-
quadruplebucky about 10 yearsyou're right, I do want to change double quotes to single quotes. type "tcpdump single quotes" into your favorite engine to understand better. It's not banal and you absolutely are in a shell environment. Neither sol8 or windows come with bash or tcpdump for what it's worth.
-
Daniel Alder about 10 years@quadruplebucky The only four characters which I know can be problematic are: ", ', $, ! . Please be more specific if you really want to help the community (and me). Google finds workrobot.com/sysadmin/security/tcpdump_expressions.html which says "On a TCPDUMP command line it is recommended to place them inside single quotes (UNIX) or double quotes (Windows) to avoid confusion and possible parsing errors."
-
Olivier S about 10 yearsWhere do you provide an answer to the question?
-
quadruplebucky about 10 years
-
quadruplebucky about 10 yearsAll of those tools will answer the question of connections over a period of time. I should have made that more explicit than "have a look at"
-
Olivier S about 10 yearsread again the question. This is linux, not BSD. This is not about forensic, about graphs, about db logging. This is not about "what tool?" but "how can I?", it is not "connections over a period of time" but "total number of connections to a port per source IP for period of time". Look the first 2 answers: they actually did answer the question.
-
quadruplebucky about 10 yearsThey all run on linux and are available as packages in most distros. Since the question doesn't specify how long the period is or how many connections there are I found iptables + you parse it yourself to be unsatisfactory reimplementation of the wheel. You are more than welcome to disagree and downvote me.
-
Daniel Alder about 10 years
-
iSee about 10 years
-m stateseems to be needed when using iptables-1.4.7-4.el6.i686. -
iSee about 10 yearsWhat iptables rules are needed in order to have
/proc/net/ip_conntrack? I don't have it with the rule from Jenny D's answer. I'm using Scientific Linux 6. -
Jacek Lakomiec about 10 yearsHaving /proc/net/ip_conntrack in your system is not a matter of iptables rules used. It's a matter of what kernel features/modules have you enabled in your kernel. I could think of: CONFIG_NF_CONNTRACK_PROC_COMPAT=y , CONFIG_NF_CONNTRACK_IPV4=y and CONFIG_NF_CONNTRACK=y. Alternatively via modules:
# lsmod | grep -i conn nf_conntrack_ipv4 9833 3 iptable_nat,nf_nat nf_conntrack 46391 3 iptable_nat,nf_nat,nf_conntrack_ipv4 nf_defrag_ipv4 1139 1 nf_conntrack_ipv4 -
iSee about 10 yearsThe kernel config has
# CONFIG_NF_CONNTRACK_PROC_COMPAT is not set. Inserting thenf_conntrack_ipv4kernel module did not help. -
Dave Forgac about 10 yearsThis answer works and is the simplest for me in this situation. If I weren't able to modify iptables the tcpdump method would work too.
-
fche almost 10 yearsFWIW, using netfilter probes in systemtap would be more efficient.
-
iSee almost 10 years@fche, are you referring to
probe::netfilter.ip.local_in? -
fche almost 10 yearsYup. Yup. Yup. Yup.
-
 Admin almost 2 yearsWe disable conntrack kernel module as it has too much overhead when working with large amounts of pps, so this wont work.