How Do I connect two coordinates with a line using Leaflet in R
Solution 1
Here is an alternative way using the leaflet package. I just took two data points in your data for the purpose of demonstration.
mydf <- data.frame(Observation = c("A", "B"),
                   InitialLat = c(62.469722,48.0975),
                   InitialLong = c(6.187194, 16.3108),
                   NewLat = c(51.4749, 51.4882),
                   NewLong = c(-0.221619, -0.302621),
                   stringsAsFactors = FALSE)
I changed the format of mydf and create a new data frame for leaflet. You can reshape your data in various ways.
mydf2 <- data.frame(group = c("A", "B"),
                    lat = c(mydf$InitialLat, mydf$NewLat),
                    long = c(mydf$InitialLong, mydf$NewLong))

#  group      lat      long
#1     A 62.46972  6.187194
#2     B 48.09750 16.310800
#3     A 51.47490 -0.221619
#4     B 51.48820 -0.302621

library(leaflet)
library(magrittr)

leaflet()%>%
addTiles() %>%
addPolylines(data = mydf2, lng = ~long, lat = ~lat, group = ~group)
I trimmed the interactive map I got. Please see the map below. Although two lines are connected in this image, they are separated. If you run the code and zoom in, you will see that the two lines are separated.

Solution 2
Leaflet can add lines using the addPolylines function. The problem with this is it assumes every line is connected - you will get them all linked.
The best way to fix this (AFAIK) is to use a loop:
library(leaflet)
map3 = leaflet(data) %>% addTiles()
map3 <- map3 %>% addMarkers(~InitialLong,~InitialLat, popup=~Observation)
for(i in 1:nrow(data)){
    map3 <- addPolylines(map3, lat = as.numeric(data[i, c(2, 4)]),
                               lng = as.numeric(data[i, c(3, 5)]))
}
map3
EDIT: There is also an easier way using the points_to_line function by Kyle Walker (see the very bottom for a pasted copy of the code).
First reshape the data, so the starts and ends are in the same columns:
library(tidyr)
library(dplyr)
z <- gather(dta, measure, val, -Observation) %>% group_by(Observation) %>%
            do(data.frame(   lat=c(.[["val"]][.[["measure"]]=="InitialLat"],
                                   .[["val"]][.[["measure"]]=="NewLat"]),
                          long = c(.[["val"]][.[["measure"]]=="InitialLong"],
                                   .[["val"]][.[["measure"]]=="NewLong"])))
Then call points_to_line
z <- as.data.frame(z)
y <- points_to_line(z, "long", "lat", "Observation")
Now plot:
map3 = leaflet(data) %>% addTiles()
map3 %>% addMarkers(~InitialLong, ~InitialLat, popup = ~Observation) %>%
         addPolylines(data = y)
Source of points_to_line by Kyle Walker:
library(sp)
library(maptools)

points_to_line <- function(data, long, lat, id_field = NULL, sort_field = NULL) {

  # Convert to SpatialPointsDataFrame
  coordinates(data) <- c(long, lat)

  # If there is a sort field...
  if (!is.null(sort_field)) {
    if (!is.null(id_field)) {
      data <- data[order(data[[id_field]], data[[sort_field]]), ]
    } else {
      data <- data[order(data[[sort_field]]), ]
    }
  }

  # If there is only one path...
  if (is.null(id_field)) {

    lines <- SpatialLines(list(Lines(list(Line(data)), "id")))

    return(lines)

    # Now, if we have multiple lines...
  } else if (!is.null(id_field)) {

    # Split into a list by ID field
    paths <- sp::split(data, data[[id_field]])

    sp_lines <- SpatialLines(list(Lines(list(Line(paths[[1]])), "line1")))

    # I like for loops, what can I say...
    for (p in 2:length(paths)) {
      id <- paste0("line", as.character(p))
      l <- SpatialLines(list(Lines(list(Line(paths[[p]])), id)))
      sp_lines <- spRbind(sp_lines, l)
    }

    return(sp_lines)
  }
}
Solution 3
Think this one is what you want:
install.packages("leaflet")
library(leaflet)

mydf <- data.frame(Observation = c("A", "B","C","D","E"),
               InitialLat = c(62.469722,48.0975,36.84,50.834194,50.834194),
               InitialLong = c(6.187194, 16.3108,-2.435278,4.298361,4.298361),
               NewLat = c(51.4749, 51.4882,50.861822,54.9756,54.9756),
               NewLong = c(-0.221619, -0.302621,-0.083278,-1.62179,-1.62179),
               stringsAsFactors = FALSE)

mydf
 Observation InitialLat InitialLong   NewLat   NewLong
1           A   62.46972    6.187194 51.47490 -0.221619
2           B   48.09750   16.310800 51.48820 -0.302621
3           C   36.84000   -2.435278 50.86182 -0.083278
4           D   50.83419    4.298361 54.97560 -1.621790
5           E   50.83419    4.298361 54.97560 -1.621790

m<-leaflet(data=mydf)%>%addTiles
for (i in 1:nrow(mydf))
m<-m%>%addPolylines(lat=c(mydf[i,]$InitialLat,mydf[i,]$NewLat),lng=c(mydf[i,]$InitialLong,mydf[i,]$NewLong))
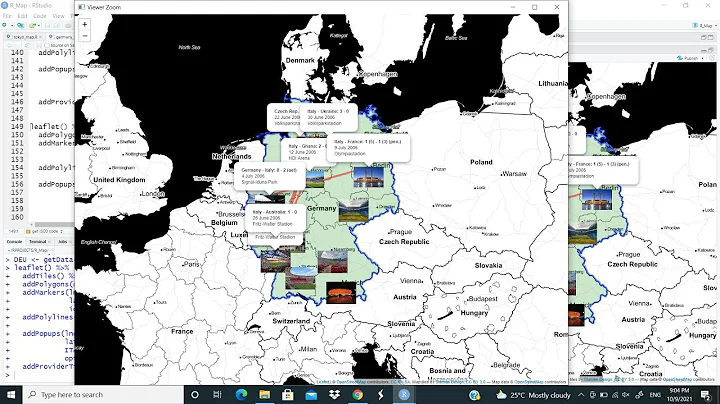
And it shows: Network Connection using Leaflet
Solution 4
Depending on what the purpose of the lines is, another great option is gcIntermediate(). It outputs a CURVED SpatialLines object, based on the curvature of the earth. Not great for directions though. SpatialLines class objects work very well with Leaflet. See here for an excellent example. I've posted a modified form, that starts with the data frame from Paul Reiners.
library(leaflet)
library(geosphere)

mydf <- data.frame(InitialLat = c(62.469722,48.0975), # initial df
               InitialLong = c(6.187194, 16.3108),
               NewLat = c(51.4749, 51.4882),
               NewLong = c(-0.221619, -0.302621))

p1 <- as.matrix(mydf[,c(2,1)]) # it's important to list lng before lat here
p2 <- as.matrix(mydf[,c(4,3)]) # and here

gcIntermediate(p1, p2,
           n=100,
           addStartEnd=TRUE,
           sp=TRUE) %>%
leaflet() %>%
addTiles() %>%
addPolylines()
Solution 5
I know this was asked a year ago but I had the same question and figured out how to do it in leaflet.
You are first going to have to adjust your dataframe because addPolyline just connects all the coordinates in a sequence. I will make a dataframe with 4 separate ending locations for the purpose of this demonstration.
dest_df <- data.frame (lat = c(41.82, 46.88, 41.48, 39.14),
                   lon = c(-88.32, -124.10, -88.33, -114.90)
                  )
Next, I am going to create a data frame with the central location of the same size (4 in this example) of the destination locations. I will explain why I'm doing this soon
orig_df <- data.frame (lat = c(rep.int(40.75, nrow(dest_df))),
                   long = c(rep.int(-73.99,nrow(dest_df)))
                  )
The reason why I am doing this is because the addPolylines feature will connect all the coordinates in a sequence. The way to get around this in order to create the image you described is by starting at the starting point, then going to destination point, and then back to the starting point, and then to the next destination point. In order to create the dataframe to do this, we will have to interlace the two dataframes by placing in rows as such:
starting point - destination point 1 - starting point - destination point 2 - and so forth...
The way I will do is create a key for both data frames. For the origin dataframe, I will start at 1, and increment by 2 (e.g., 1 3 5 7). For the destination dataframe, I will start at 2 and increment by 2 (e.g., 2, 4, 6, 8). I will then combine the 2 dataframes using a UNION all. I will then sort by my sequence to make every other row the starting point. I am going to use sqldf for this because that is what I'm comfortable with. There may be a more efficient way.
orig_df$sequence <- c(sequence = seq(1, length.out = nrow(orig_df), by=2))
dest_df$sequence <- c(sequence = seq(2, length.out = nrow(orig_df), by=2))

library("sqldf")
q <- "
SELECT * FROM orig_df
UNION ALL
SELECT * FROM dest_df
ORDER BY sequence
"
poly_df <- sqldf(q)
The new dataframe looks like this Notice how the origin locations are interwoven between the destination
And finally, you can make your map:
library("leaflet")
leaflet() %>%
  addTiles() %>%

  addPolylines(
    data = poly_df,
    lng = ~lon,
    lat = ~lat,
    weight = 3,
    opacity = 3
  )
And finally it should look like this I hope this helps anyone who is looking to do something like this in the future
Related videos on Youtube
 09 : 33
 25 : 07
 16 : 14
 10 : 30
 06 : 21
 09 : 57
 01 : 48 : 55
 08 : 28
 22 : 09
 10 : 57
![Create your first Shiny App in R using Leaflet [Tutorial]](https://i.ytimg.com/vi/IQfsHnUYrFo/hq720.jpg?sqp=-oaymwEcCNAFEJQDSFXyq4qpAw4IARUAAIhCGAFwAcABBg==&rs=AOn4CLDWOKxZKGJk_lR-mnpwi4WYTj-G-A) 12 : 27
12 : 27
maluwalmk
Updated on March 22, 2020Comments
-
maluwalmk about 4 years
I am trying to use Leaflet package in R to draw a amp and connect the markers given the latitude and longitude information in the table below.
    | Observation | InitialLat | InitialLong | NewLat    | NewLong   |
    |-------------|------------|-------------|-----------|-----------|
    | A           | 62.469722  | 6.187194    | 51.4749   | -0.221619 |
    | B           | 48.0975    | 16.3108     | 51.4882   | -0.302621 |
    | C           | 36.84      | -2.435278   | 50.861822 | -0.083278 |
    | D           | 50.834194  | 4.298361    | 54.9756   | -1.62179  |
    | E           | 50.834194  | 4.298361    | 54.9756   | -1.62179  |
    | F           | 50.834194  | 4.298361    | 51.4882   | -0.302621 |
    | G           | 47.460427  | -0.530804   | 51.44     | -2.62021  |
    | H           | 51.5549    | -0.108436   | 53.4281   | -1.36172  |
    | I           | 51.5549    | -0.108436   | 52.9399   | -1.13258  |
    | J           | 51.5549    | -0.108436   | 51.889839 | -0.193608 |
    |             | 51.5549    | -0.108436   | 52.0544   | 1.14554   |
I want to draw lines from an initial point given by the coordinates in the
InitialLatandInitialLongcolumns to an end point given by theNewLatandNewLongcolumns.Here is my current R code which only draws the markers on the map.
library(leaflet) map3 = leaflet(data) %>% addTiles() map3 %>% addMarkers(~InitialLong,~InitialLat, popup=~Observation) -
 Remko Duursma about 5 yearsI imagine this used to work, but it really doesn't anymore. Even using ~group, leaflet connects all polylines (also when "zooming in on this map").
 -
 Yeshyyy about 4 yearsamazing David thank you! a tiny mistake in the addPolylines(). it should be lng = ~long instead of lon.