How to determine what is the probability distribution function from a numpy array?
Assuming you have used the test correctly, my guess is that you have a small deviation from a normal distribution and because your sample size is so large, even small deviations will lead to a rejection of the null hypothesis of a normal distribution.
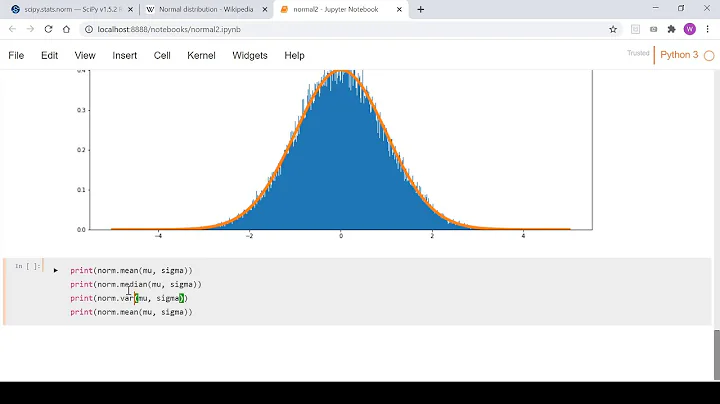
One possibility is to visually inspect your data by plotting a normed histogram with a large number of bins and the pdf with loc=data.mean() and scale=data.std().
There are alternative test for testing normality, statsmodels has Anderson-Darling and Lillifors (Kolmogorov-Smirnov) tests when the distribution parameters are estimated.
However, I expect that the results will not differ much given the large sample size.
The main question is whether you want to test whether your sample comes "exactly" from a normal distribution, or whether you are just interested in whether your sample comes from a distribution that is very close to the normal distribution, close in terms of practical usage.
To elaborate on the last point:
http://jpktd.blogspot.ca/2012/10/tost-statistically-significant.html http://www.graphpad.com/guides/prism/6/statistics/index.htm?testing_for_equivalence2.htm
As the sample size increases a hypothesis test gains more power, that means that the test will be able to reject the null hypothesis of equality even for smaller and smaller differences. If we keep our significance level fixed, then eventually we will reject tiny differences that we don't really care about.
An alternative type of hypothesis test is where we want to show that our sample is close to the given point hypothesis, for example two samples have almost the same mean. The problem is that we have to define what our equivalence region is.
In the case of goodness of fit tests we need to choose a distance measure and define a threshold for the distance measure between the sample and the hypothesized distribution. I have not found any explanation where intuition would help to choose this distance threshold.
stats.normaltest is based on deviations of skew and kurtosis from those of the normal distribution.
Anderson-Darling is based on a integral of the weighted squared differences between the cdf.
Kolmogorov-Smirnov is based on the maximum absolute difference between the cdf.
chisquare for binned data would be based on the weighted sum of squared bin probabilities.
and so on.
I only ever tried equivalence testing with binned or discretized data, where I used a threshold from some reference cases which was still rather arbitrary.
In medical equivalence testing there are some predefined standards to specify when two treatments can be considered as equivalent, or similarly as inferior or superior in the one sided version.
Related videos on Youtube
 16 : 17
 32 : 47
 23 : 19
 24 : 08
 16 : 03
 10 : 02
 16 : 23
 06 : 47
user3565679
Updated on June 17, 2022Comments
-
user3565679 almost 2 years
I have searched around and to my surprise it seems that this question has not been answered.
I have a Numpy array containing 10000 values from measurements. I have plotted a histogram with Matplotlib, and by visual inspection the values seem to be normally distributed:

However, I would like to validate this. I have found a normality test implemented under scipy.stats.mstats.normaltest, but the result says otherwise. I get this output:
(masked_array(data = [1472.8855375088663],
         mask = [False],
   fill_value = 1e+20)
, masked_array(data = [ 0.],
         mask = False,
   fill_value = 1e+20)
)
which means that the chances that the dataset is normally distributed are 0. I have re-run the experiments and tested them again obtaining the same outcome, and in the "best" case the p value was 3.0e-290.
I have tested the function with the following code and it seems to do what I want:
import numpy
import scipy.stats as stats

mu, sigma = 0, 0.1
s = numpy.random.normal(mu, sigma, 10000)

print stats.normaltest(s)

(1.0491016699730547, 0.59182113002186942)
If I have understood and used the function correctly it means that the values are not normally distributed. (And honestly I have no idea why there is a difference in the output, i.e. less details.)
I was pretty sure that it is a normal distribution (although my knowledge of statistics is basic), and I don't know what could the alternative be. How can I check what is the probability distribution function in question?
EDIT:
My Numpy array containing 10000 values is generated like this (I know that's not the best way to populate a Numpy array), and afterwards the normaltest is run:
values = numpy.empty(shape=10000, 1))
for i in range(0, 10000):
    values[i] = measurement(...) # The function returns a float

print normaltest(values)
EDIT 2:
I have just realised that the discrepancy between the outputs is because I have inadvertently used two different functions (scipy.stats.normaltest() and scipy.stats.mstats.normaltest()), but it does not make a difference since the relevant part of the output is the same regardless of the used function.
EDIT 3:
Fitting the histogram with the suggestion from askewchan:
plt.plot(bin_edges, scipy.stats.norm.pdf(bin_edges, loc=values.mean(), scale=values.std()))results in this:

EDIT 4:
Fitting the histogram with the suggestion from user user333700:
scipy.stats.t.fit(data)results in this:

-
Teepeemm about 10 yearsI'm not understanding how
normaltestis givingmasked_array. Could you fill in that code a bit more? -
user3565679 about 10 years@Teepeemm: I have added the code.
-
askewchan about 10 yearsWhat if you plot over your histogram with
plt.plot(bin_edges, scipy.stats.norm.pdf(bin_edges, loc=values.mean(), scale=values.std()))? -
Josef about 10 years@Teepeemm
stats.mstats.normaltestis the masked array version that can also handle missing values and returns a masked array even if the input is a standard numpy array.stats.normaltestis the pure numpy array version that doesn't check for missing values. -
user3565679 about 10 years@user333700: This is true, I have edited the original post (see Edit 2).
-
 Akavall about 10 yearsYou are very likely rejecting the null due to large sample size, a good way to address this is to look at Q-Q plot. Here is good source on this: stats.stackexchange.com/questions/2492/…
 -
user3565679 about 10 years@askewchan: I have plotted that over the histogram and I have put the result in the post under Edit 3.
-
Josef about 10 yearsThat doesn't even look close to normal, maybe closer to a t distribution with a small degrees of freedom.
-
user3565679 about 10 years@user333700: hm... I will then try to fit a t distribution.
-
Josef about 10 yearsThe maximum likelihood estimator using
scipy.stats.t.fit(data)should work quite well for fitting a t-distribution. -
user3565679 about 10 years@user333700: Thanks. I have added the result under Edit 4. It is not perfect, but it is much better.
-
-
user3565679 about 10 yearsI find it interesting that the normaltest is sensitive to the size of the sample (actually I expected that the certainty of the function would increase). I am interested in the latter from your last paragraph (whether the sample comes from a distribution that is very close to the normal distribution).
-
Sitz Blogz about 8 yearsThis is interesting. I am trying to know how to understand the distribution of the array I have. It is a raw data set and I want to understand the distribution of the same. I am trying to plot a probability distribution function but I am not able to find how to come through that. Any suggestions on that area will be a huge help. Thanks