How to find which Process is causing High CPU usage
Solution 1
top will display what is using your CPU. If you have it installed, htop allows you more fine-grained control, including filtering by—in your case—CPU
Solution 2
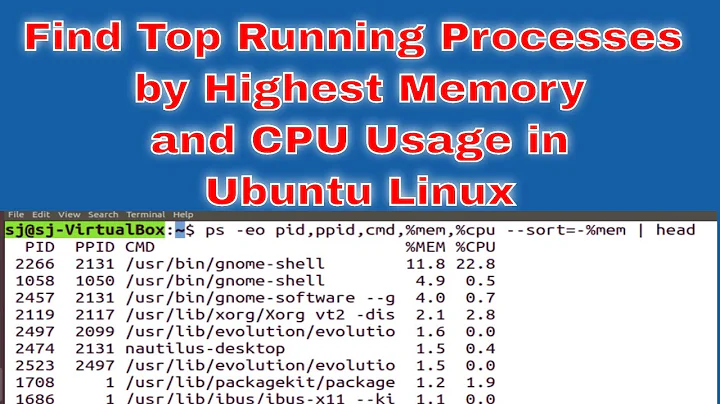
ps -eo pcpu,pid,user,args | sort -k1 -r -n | head -10
Works for me, show the top 10 cpu using threads, sorted numerically
Solution 3
In addition to ps and top commands, you can also run vmstat to figure out what is happening in terms of CPU, memory usage on the system, i.e.:
vmstat 1 100
With the above, you get 100 samples a second apart of various stats. When the r or b column has a number (higher = more resources used) there is a script that is blocking. r is CPU, b is generally IO blocking such as disk or network.
Example output:
$ vmstat 1 100
procs -----------memory---------- ---swap-- -----io---- -system-- ------cpu-----
 r  b   swpd   free   buff  cache   si   so    bi    bo   in   cs us sy id wa st
 0  0      0 288700  17592 1920048    0    0  4482  3297   47  155  8  2 78 12  0
 0  0      0 268420  17904 1920584    0    0   788    36 4095 4759 11  3 85  1  0
 0  0      0 269916  17940 1920868    0    0   108   560 6969 7280 11  2 86  1  1
 3  0      0 267684  18196 1921304    0    0   256     0 5934 6094  9  2 90  0  0
 0  0      0 257800  18196 1921528    0    0     0     0 5412 5508 10  1 89  0  1
 1  0      0 257368  18196 1922028    0    0     0     0 5852 6046  9  1 89  0  1
 0  0      0 256872  18200 1922236    0    0     0     0 5345 5566  9  1 90  0  0
 0  0      0 256688  18208 1922292    0    0     0  1788 5388 5602  7  2 90  1  1
 0  0      0 256520  18208 1922684    0    0     0     0 5387 5557  8  1 91  0  0
 1  0      0 255788  18208 1923024    0    0     0     0 4992 5363 10  1 89  0  1
 1  0      0 255392  18208 1923456    0    0     0     0 5027 5145 13  1 86  0  0
 0  0      0 254980  18208 1923792    0    0     0     0 5042 5082 21  1 77  0  1
 0  0      0 254452  18216 1924092    0    0     0  1848 5481 5695  7  1 91  1  1
 0  0      0 254416  18216 1924268    0    0     0     0 4947 5250  7  1 92  0  0
 1  0      0 253732  18216 1924616    0    0     0     0 5180 5383  8  2 90  0  1
 0  0      0 253584  18216 1924912    0    0    12     0 4464 4623  8  1 91  0  0
 0  0      0 243496  18216 1925224    0    0     0     0 5507 5700  9  1 90  0  1
 0  0      0 243008  18224 1925504    0    0     0  1356 5070 5345  8  1 90  0  1
 1  0      0 243220  18228 1925676    0    0     0     0 6241 6533 11  2 87  0  0
Solution 4
"htop" is similar to top, but has a "colourful text-based graphical" display of your CPUs, and also displays a tree structure to processes, so you know a process has a child and how many.
It also displays laptop battery power and whether it's charging - I didn't know that before!
Solution 5
You can probably use ps xo pid,cmd --sort=%cmd | tail -1, but top will show in real time.
Related videos on Youtube
 02 : 18
 09 : 03
 05 : 50
 07 : 21
 05 : 02
Gautam
I am a coding enthusiast who is in love with the Linux Operating system. My Favorite Languages are Compiled : Its a Close tie between Java,Scala,Clojure and C Interpreted : This was until recently Headed by Python but now Ruby & JavaScript is proving to be good competitor.
Updated on September 18, 2022Comments
-
 Gautam over 1 year
Is there any way to find out from terminal which process is causing high CPU Usage ?
It would also be useful to order processes in descending order of cpu Usage
-
 Benubird over 8 yearsTop is often less than useful. First because processes often fluctuate - it's not unusual to see process that is completely occupying the cpu occasionally flicker to 0% in top, and if you have multiple intensive processes running they can alternate, taking turns to use 100% while the other uses 0%, making it hard to read. Also, sometimes the numbers are just strange - e.g. right now my top is reporting that all individual processes are using 0% cpu, but the total is 52% - so which one is doing it?
 -
 rustyhu about 2 yearsThe title line
%CPU PID USER COMMANDsometimes will be printed, as one of the top 10 :)