How to get a thread and heap dump of a Java process on Windows that's not running in a console
Solution 1
You can use jmap to get a dump of any process running, assuming you know the pid.
Use Task Manager or Resource Monitor to get the pid. Then
jmap -dump:format=b,file=heap.hprof <pid>
to get the heap for that process.
For systems where bash and pgrep are installed and a single Java process is running, try:
jmap -dump:format=b,file=heap.hprof $(pgrep java)
Solution 2
You are confusing two different java dumps. kill -3 generates a thread dump, not a heap dump.
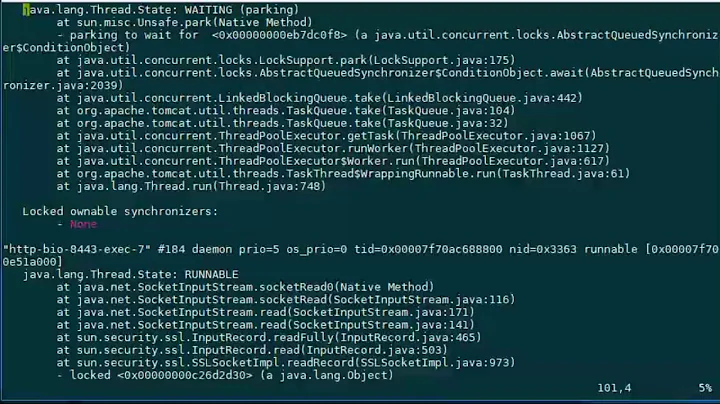
Thread dump = stack traces for each thread in the JVM output to stdout as text.
Heap dump = memory contents for the JVM process output to a binary file.
To take a thread dump on Windows, CTRL+BREAK if your JVM is the foreground process is the simplest way. If you have a unix-like shell on Windows like Cygwin or MobaXterm, you can use kill -3 {pid} like you can in Unix.
To take a thread dump in Unix, CTRL+C if your JVM is the foreground process or kill -3 {pid} will work as long as you get the right PID for the JVM.
With either platform, Java comes with several utilities that can help. For thread dumps, jstack {pid} is your best bet. http://docs.oracle.com/javase/1.5.0/docs/tooldocs/share/jstack.html
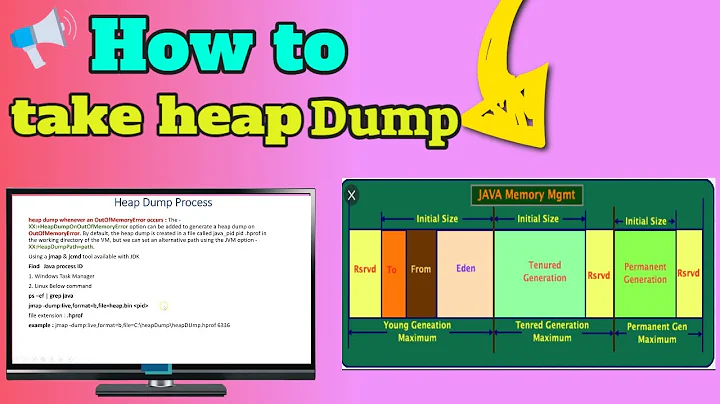
Just to finish the dump question out: Heap dumps are not commonly used because they are difficult to interpret. But, they have a lot of useful information in them if you know where/how to look at them. The most common usage is to locate memory leaks. It is a good practice to set the -D on the java command-line so that the heap dump is generated automatically upon an OutOfMemoryError, -XX:+HeapDumpOnOutOfMemoryError But, you can manually trigger a heap dump, also. The most common way is to use the java utility jmap.
NOTE: this utility is not available on all platforms. As of JDK 1.6, jmap is available on Windows.
An example command-line would look something like
jmap -dump:file=myheap.bin {pid of the JVM}
The output "myheap.bin" is not human readable (for most of us), and you will need a tool to analyze it. My preference is MAT. http://www.eclipse.org/mat/
Solution 3
I think the best way to create .hprof file in Linux process is with jmap command. For example: jmap -dump:format=b,file=filename.hprof {PID}
Solution 4
In addition to using the mentioned jconsole/visualvm, you can use jstack -l <vm-id> on another command line window, and capture that output.
The <vm-id> can be found using the task manager (it is the process id on windows and unix), or using jps.
Both jstack and jps are include in the Sun JDK version 6 and higher.
Solution 5
I recommend the Java VisualVM distributed with the JDK (jvisualvm.exe). It can connect dynamically and access the threads and heap. I have found in invaluable for some problems.
Related videos on Youtube
 09 : 59
 24 : 04
 58 : 05
 16 : 45
 08 : 27
 04 : 43
 06 : 34
 15 : 34
 09 : 30
Kasun Siyambalapitiya
BSc(Special) in Computing and Information Systems at Sabaragamuwa University of Sri Lanka
Updated on February 12, 2022Comments
-
 Kasun Siyambalapitiya about 2 years
I have a Java application that I run from a console which in turn executes an another Java process. I want to get a thread/heap dump of that child process.
On Unix, I could do a
kill -3 <pid>but on Windows AFAIK the only way to get a thread dump is Ctrl-Break in the console. But that only gives me the dump of the parent process, not the child.Is there another way to get that heap dump?
-
iny over 15 years
-
-
Vanchinathan Chandrasekaran over 12 yearsThese tools are not supported in Java 1.6. Java 1.6 has only jconsole.
-
ankon over 12 yearsYou might be mixing up JDK and JRE, I explicitly mentioned JDK. See the documentation for the tools: download.oracle.com/javase/6/docs/technotes/tools/share/… and download.oracle.com/javase/6/docs/technotes/tools/share/…
-
lava almost 11 yearsThanks Daniel. Where is this file created on a windows machine ? Is there a default path ?
-
kamczak over 10 years@lava You can set the path through -XX:HeapDumpPath, as described at Oracle's VM Options page.
-
nafg over 9 yearsOn my linux Ctrl-C interrupts (terminates) it, I do Ctrl-\
-
 mjaggard about 9 yearsThis thread has become so popular that I've just heard someone referring to a heap dump as a "cheap.bin"
 -
 ChiefTwoPencils almost 9 yearsConsider this and its general impact on "To take a thread dump on Windows, CTRL+BREAK". It's actually dependent on the engineering decision of the manufacturer. FE, Lenova, IIRC, is cntrl+fn+p.
 -
Hammad Dar over 8 yearsThat's most of the times not feasible as it has an overhead attached to it and thread dumps are generally retrieved from production machines.
-
 Jaberino about 8 yearsoriginal question is about a 'not-runnin' process. It's likely that jvisualvm cannot connect.
 -
Lawrence Dol about 8 years@Jaberino: No, it's about a currently running Java process, in Windows, with no console associated with it.
-
Basil about 7 yearsAwesome. I wanted to run a test overnight in hopes of showing memory leak but was worried of OOM and crashign while I'm not present. This is perfect.
-
xeruf over 6 yearsbest answer by far! Didn't know of this till now and it's really practical!
-
Pragalathan M almost 6 yearsIn most of the production systems, we only have jre and not jdk. So this helps.
-
bitsabhi over 5 yearsMake sure to use correct user which started the java process. In my case it was tomcat8 ps -C java -o pid sudo -u tomcat8 jmap -dump:format=b,file=<filename> <pid>
-
Vadzim over 5 yearsIn latest java releases Java VisualVM was superceded by JMC/JFR. See also What are the differences between JVisualVM and Java Mission Control?
-
Vadzim over 5 yearsBut jstack prooved to be more reliable alternative on Windows: stackoverflow.com/a/47723393/603516