How to get Java8 Metaspace dump (not heap dump)
18,951
It seems you encounter a class loading leak.
Use
jmap -clstats PIDto dump class loader statistics;jcmd PID GC.class_statsto print the detailed information about memory usage of each loaded class. The latter requires-XX:+UnlockDiagnosticVMOptions.
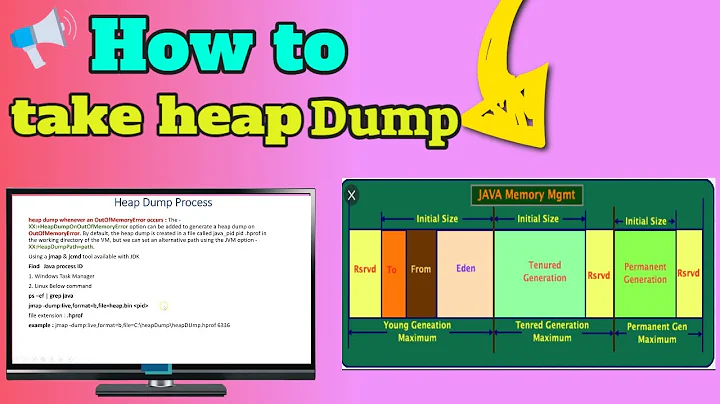
The heap dump will also help, because each class in the Metaspace has a corresponding java.lang.Class instance in the heap.
Related videos on Youtube
 33 : 17
How to analyse the heap dump?
 12 : 26
JVM Heap Dump Analysis - OpenJPA memory leak
 04 : 43
Java Heap Dump Analysis - VisualVM Tutorial
 29 : 21
Troubleshooting OutOfMemoryError - Heap dump, Eclipse MAT
 14 : 04
Java 8 Metaspace
 15 : 34
How to take heap dump and Rread, analyze heap dump file by free software VisualVM | .hprof file
Author by
czh
Updated on June 14, 2022Comments
-
czh almost 2 years
Are there any tools that are able to get Metaspace dump from a Java8 hotspot vm ?
-
 apangin almost 8 yearsIn which form would you like to get this and what for? Note that data in Metaspace are not Java objects. Probably you're not interested in HotSpot internal structures, but in something else.
 -
czh almost 8 yearsWe have an application causes Metaspace OOM error with 1G of MaxMetaspaceSize, and I wanted to know how Metaspace memories are being used.
-
-
czh almost 8 yearsHi apangin, thanks for your advice. I was able to dump the entire heap using jmap -dump command, however I am struggling to run jhat command to analyze the dump file. The heap dump is about 5GB, and jhat has been running 2 hours without completion, is this normal?
-
czh almost 8 yearsjhat eventually terminated with heap space OOM error after running about 2 hours.
-
apangin almost 8 years@czh Eclipse Memory Analyzer works fine even with large heap dumps.
-
Vishy almost 8 years@czh You can also try VisualVM or YourKit for larger heaps.
-
machinarium about 5 yearsHow to interpret below statistics to know whether my fix of METASPACE OOM is working? Dump Reason : JCMD MaxMetaspaceSize : 536870912 B CompressedClassSpaceSize : 528482304 B Class Space Used : 21412264 B Class Space Capacity : 25373696 B Class Space Committed : 44572672 B Class Space Reserved : 1073741824 B NonClass Spaces Used : 178477376 B NonClass Spaces Capacity : 219028480 B NonClass Spaces Committed : 347594752 B NonClass Spaces Reserved : 348127232 B