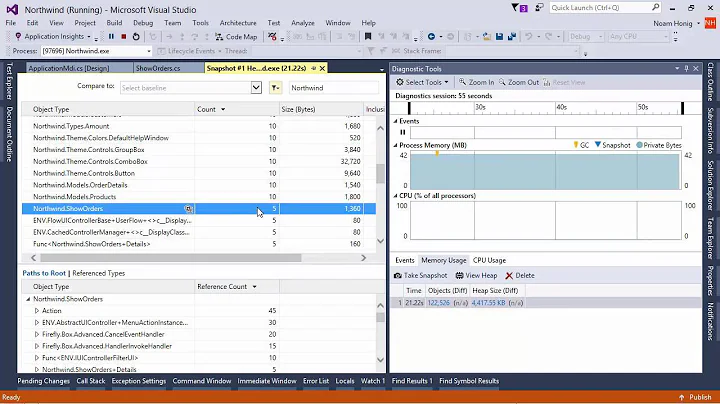
How to measure memory usage for a Live ASP.NET MVC web application?
Perfmon's counters are still a good technique (and free!).
PAL (Performance Analysis of Logs), a free tool, has an ASP.NET perfmon counter template for general health (in addition to generating reports of counter log files based on thresholds).
Check out:
Commercial tools like MemProfiler, RedGate's memory profiling tool and JetBrains Profiler are all very good (and all have free trials).
Related videos on Youtube
 01 : 07 : 51
 01 : 05 : 29
 09 : 21
 05 : 17
![MVC State Management [Cookies, Sessions, Application State & TempData]](https://i.ytimg.com/vi/JzqQdbqAa2g/hq720.jpg?sqp=-oaymwEcCNAFEJQDSFXyq4qpAw4IARUAAIhCGAFwAcABBg==&rs=AOn4CLAZGQKXRON36wZOOXzpkhF19by6WA) 28 : 29
28 : 29
 37 : 32
 01 : 07 : 49
 09 : 31
RPM1984
~ Past ~: Mainframes (Model 204, JCL) Java (J2SE, J2EE) Oracle VB.NET ASP.NET Web Forms/MVC ~ Present ~ .NET Core TDD, DDD (all the DDs!) Microservices Containers
Updated on June 05, 2022Comments
-
RPM1984 about 2 years
So right off the bat, not sure if this question is better suited for another StackExchange site.
I've got an ASP.NET MVC 3 web application running on Windows Server 2008 and IIS 7.5
Site runs fine initially, but i can see the memory usage gradually growing. After about 12 hours it's nearly out of memory and the site chokes.
I'm using a lot of caching, so i'm thinking this combined with some possibly memory leaks is the cause of the issue.
So my question - what's the best way (tools, for example) to monitor memory usage on a web server running ASP.NET MVC?
In the past i've used good old' perfmon and put the IIS counters on to measure these things.
It this still the best way, and if so, can someone recommend a good perfmon counter template for my scenario?
-
 ngm over 10 yearsDid you discover what was causing the excessive memory usage?
 -
RPM1984 over 10 years@ngm - looong time ago now, but i think it was due to the fact i was sticking too much in the cache and never expiring it.
-