How to plot annotated heatmap on plotly?
Solution 1
Edit
It's now possible to do it easily with plotly.figure_factory:
https://plot.ly/python/annotated_heatmap/
As far as I know, it is still not possible to convert Matplotlib's heatmaps into Plotly's though.
Aug 2015 Answer
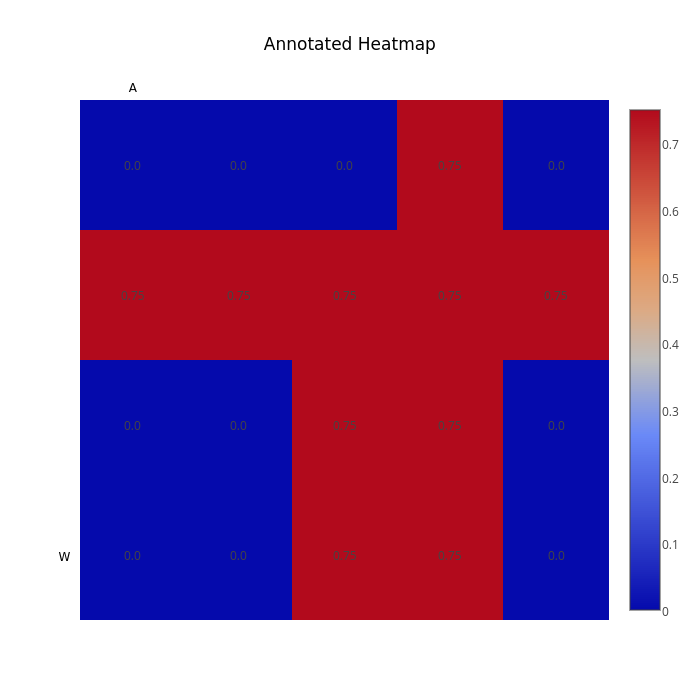
Here's an example of making an annotated heatmap with the python api:
import plotly.plotly as py
import plotly.graph_objs as go

x = ['A', 'B', 'C', 'D', 'E']
y = ['W', 'X', 'Y', 'Z']

#       x0    x1    x2    x3    x4
z = [[0.00, 0.00, 0.75, 0.75, 0.00],  # y0
     [0.00, 0.00, 0.75, 0.75, 0.00],  # y1
     [0.75, 0.75, 0.75, 0.75, 0.75],  # y2
     [0.00, 0.00, 0.00, 0.75, 0.00]]  # y3

annotations = go.Annotations()
for n, row in enumerate(z):
    for m, val in enumerate(row):
        annotations.append(go.Annotation(text=str(z[n][m]), x=x[m], y=y[n],
                                         xref='x1', yref='y1', showarrow=False))

colorscale = [[0, '#3D9970'], [1, '#001f3f']]  # custom colorscale
trace = go.Heatmap(x=x, y=y, z=z, colorscale=colorscale, showscale=False)

fig = go.Figure(data=go.Data([trace]))
fig['layout'].update(
    title="Annotated Heatmap",
    annotations=annotations,
    xaxis=go.XAxis(ticks='', side='top'),
    yaxis=go.YAxis(ticks='', ticksuffix='  '),  # ticksuffix is a workaround to add a bit of padding
    width=700,
    height=700,
    autosize=False
)
print py.plot(fig, filename='Stack Overflow 31756636', auto_open=False)  # https://plot.ly/~theengineear/5179
With the result at https://plot.ly/~theengineear/5179
Linking a related GitHub issue: https://github.com/plotly/python-api/issues/273
Solution 2
You have to use Plotly's declarative syntax, instead of converting from matplotlib to Python. Plotly only supports the matplotlib figure objects that it can reverse engineer, and unfortunately heatmaps aren't one of them. Here are the Plotly Python heatmap docs: https://plot.ly/python/heatmaps/ And here are the Plotly Python annotation docs: https://plot.ly/python/text-and-annotations/ Make sure to set the annotations to be referenced to the data rather than the page.
You could also overlay a scatter plot with a hover text field on the heatmap, but set the mode of the scatter plot to text. This would make only the text show and not the scatter plot points. Docs: https://plot.ly/python/text-and-annotations/
Admin
Updated on June 04, 2022Comments
-
 Admin about 2 years
I'm trying to make a annotated heatmap on plotly.
import plotly.plotly as py
import plotly.tools as tls
from plotly.graph_objs import *
import numpy as np
import pandas as pd
import matplotlib.pyplot as plt

df = pd.read_csv('masterc.csv')

locations = {}
anno = []

for i in range(df.shape[0]):
    locations.setdefault((df.iat[i,2],df.iat[i,6]),0)
    locations[(df.iat[i,2],df.iat[i,6])]+=df.iat[i,8]

x1 = []
y1 = []
z1 = []
z1_text = []

for key in locations.keys():
    if key[0] not in x1:
        x1 += [key[0],]
    if key[1] not in y1:
        y1 += [key[1],]


for y in y1:
    dummy = []
    for x in x1:
        if (x,y) in locations.keys():
            dummy += [locations[(x,y)],]
        else:
            dummy += [0,]
    z1 += [dummy,]

data = z1

arr = np.array(data)

fig, ax = plt.subplots()

ax.imshow(data, cmap='seismic')

for (i, j), z in np.ndenumerate(data):
    ax.text(j, i, '{:f}'.format(z), ha='center', va='center')

ax.set_xticklabels(x1, rotation=90)
ax.set_yticklabels(y1)

#plt.show()
py.plot_mpl(fig)
I'm getting the following warning
Warning (from warnings module):
  File "C:\Python27\lib\site-packages\plotly\matplotlylib\renderer.py", line 394
    warnings.warn("Aw. Snap! You're gonna have to hold off on "
UserWarning: Aw. Snap! You're gonna have to hold off on the selfies for now. Plotly can't import images from matplotlib yet!
and finally the following error
Traceback (most recent call last):
  File "E:\Project Kumbh\heatmap with annotations.py", line 58, in <module>
    py.plot_mpl(fig)
  File "C:\Python27\lib\site-packages\plotly\plotly\plotly.py", line 261, in plot_mpl
    return plot(fig, **plot_options)
  File "C:\Python27\lib\site-packages\plotly\plotly\plotly.py", line 155, in plot
    figure = tools.return_figure_from_figure_or_data(figure_or_data, validate)
  File "C:\Python27\lib\site-packages\plotly\tools.py", line 1409, in return_figure_from_figure_or_data
    if not figure['data']:
KeyError: 'data'
Is there anyway to get around this error? Or is there any simple way to make an annotated heatmap on plotly?