How to understand an EXPLAIN ANALYZE
While not as useful for a simple plan like this, http://explain.depesz.com is really useful. See http://explain.depesz.com/s/t4fi. Note the "stats" tab and the "options" pulldown.
Things to note about this plan:
The estimated row count (183) is reasonably comparable to the actual row count (25). It's not hundreds of times more, nor is it 1. You're more interested in orders of magnitude when it comes to rowcount estimates, or "1 vs not 1" issues. (You don't even need "close enough for government work" accuracy - "close enough for military contracting accounting" will do). The selectivity estimate and statistics seem reasonable.
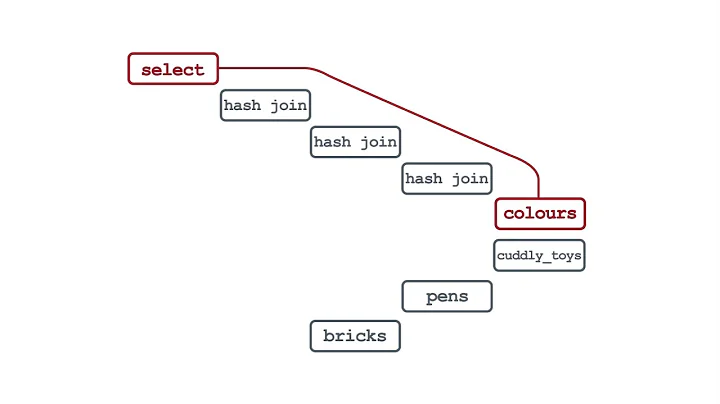
It's using the two-column partial index provided (
index scan using index_cars_onsale_on_brand_and_model_name), so it's matched the partial index condition. You can see that in theFilter: has_auto_gear. The index search condition is also shown.The query performance looks reasonable given that the table's row count will mean the index is fairly big, especially as it's over two columns. Matching rows will be scattered, so it's likely each row will require a separate page read too.
I see nothing wrong here. This query will likely benefit greatly from PostgreSQL 9.2's index-only scans, though.
It's possible there's some table bloat here, but given the 2-column index and the sheer number of rows the response time isn't entirely unreasonable, especially for a table with 170 (!!) columns that's likely to fit relatively few tuples into each page. If you can afford some downtime try VACUUM FULL to reorganize the table and rebuild the index. This will exclusively lock the table for some time while it rebuilds it. If you can't afford the downtime, see pg_reorg and/or CREATE INDEX CONCURRENTLY and ALTER INDEX ... RENAME TO.
You might find EXPLAIN (ANALYZE, BUFFERS, VERBOSE) more informative sometimes, as it can show buffer accesses, etc.
One option that may make this query faster (though it runs the risk of slowing other queries somewhat) is to partition the table on brand and enable constraint_exclusion. See partitioning.
Related videos on Youtube
 43 : 06
 10 : 15
 06 : 30
 30 : 05
 09 : 34
 59 : 59
 36 : 08
 17 : 19
 12 : 58
 06 : 44
Comments
-
Niels Kristian almost 2 years
I am not very familiar with looking at EXPLAIN ANALYZE results, I have a huge problem with my queries being too slow. I have tried to read up on how to interpret results from an explain queries, but I still don't know what I should be looking for, and what might be wrong. I have a feeling that there is some big red light flashing somewhere, I just don't see it.
So the query is pretty simple, it looks like this:
EXPLAIN ANALYZE SELECT "cars".* FROM "cars" WHERE "cars"."sales_state" = 'onsale' AND "cars"."brand" = 'BMW' AND "cars"."model_name" = '318i' AND "cars"."has_auto_gear" = TRUE LIMIT 25 OFFSET 0And the result like this:
Limit  (cost=0.00..161.07 rows=25 width=1245) (actual time=35.232..38.694 rows=25 loops=1)
  ->  Index Scan using index_cars_onsale_on_brand_and_model_name on cars  (cost=0.00..1179.06 rows=183 width=1245) (actual time=35.228..38.652 rows=25 loops=1)
        Index Cond: (((brand)::text = 'BMW'::text) AND ((model_name)::text = '318i'::text))
        Filter: has_auto_gear"
Total runtime: 38.845 ms
A little background: I'm on Postgresql 9.1.6, running on Herokus dedicated databases. My db has aprox 7,5Gb RAM, the table cars contains 3,1M rows and an aprox 2,0M of the rows has sales_state = 'onsale'. The table has 170 columns. The index that it uses looks something like this:
CREATE INDEX index_cars_onsale_on_brand_and_model_name
  ON cars
  USING btree
  (brand COLLATE pg_catalog."default" , model_name COLLATE pg_catalog."default" )
  WHERE sales_state::text = 'onsale'::text;
Anyone seeing some big obvious issue?
EDIT:
SELECT pg_relation_size('cars'), pg_total_relation_size('cars');pg_relation_size: 2058444800 pg_total_relation_size: 4900126720
SELECT pg_relation_size('index_cars_onsale_on_brand_and_model_name');pg_relation_size: 46301184
SELECT avg(pg_column_size(cars)) FROM cars limit 5000;avg: 636.9732567210792995
WITHOUT THE LIMIT:
EXPLAIN ANALYZE SELECT "cars".* FROM "cars" WHERE "cars"."sales_state" = 'onsale' AND "cars"."brand" = 'BMW' AND "cars"."model_name" = '318i' AND "cars"."has_auto_gear" = TRUE Bitmap Heap Scan on cars (cost=12.54..1156.95 rows=183 width=4) (actual time=17.067..55.198 rows=2096 loops=1) Recheck Cond: (((brand)::text = 'BMW'::text) AND ((model_name)::text = '318i'::text) AND ((sales_state)::text = 'onsale'::text)) Filter: has_auto_gear -> Bitmap Index Scan on index_cars_onsale_on_brand_and_model_name (cost=0.00..12.54 rows=585 width=0) (actual time=15.211..15.211 rows=7411 loops=1)" Index Cond: (((brand)::text = 'BMW'::text) AND ((model_name)::text = '318i'::text)) Total runtime: 56.851 ms-
Neville Kuyt over 11 yearsTry vacuuming - postgresql.org/docs/8.1/static/maintenance.html. The query plan looks reasonable, but the time certainly doesn't!
-
Niels Kristian over 11 yearsJust before I ran the query, I ran a full vacuum and an analyze as well... My website is a search engine for used cars, so the timing is by far unacceptable. My goal is to get the total time down to less than 1 sec. Do you think that is at all possible, or will I have to look for a different technology than a rational database?
-
Craig Ringer over 11 years@NielsKristian I think a big part of the problem might be the "170 columns" part. How big is the table?
SELECT pg_relation_size('cars'), pg_total_relation_size('cars');. AlsoSELECT pg_relation_size('index_cars_onsale_on_brand_and_model_name');to get the index size. What's the average row width?SELECT avg(pg_column_size(cars)) FROM test cars limit 5000; -
jcern over 11 yearsI don't see it posted above, but I was wondering if you also have an index on has_auto_gear?
-
Craig Ringer over 11 years@jcern There's a partial index with a filter condition on
has_auto_gear. Same thing but faster for this purpose. -
Neville Kuyt over 11 yearsCan you tell us what happens when you remove the LIMIT clause?
-
Niels Kristian over 11 years@CraigRinger I updated the stats in the EDIT, above... :-)
-
Niels Kristian over 11 years@NevilleK I udated with the stats above
-
Craig Ringer over 11 yearsThat's a 4.5GB table including TOAST tables and indexes; 2GB for the raw table without external storage. The index is tiny, though, 44MB. Each row is 600 bytes wide on average, which is pretty big but not insanely huge. I'd expect better performance than this. I'd be curious to know how it performed if you dumped the table, loaded it onto a local PostgreSQL instance on a half-decent computer and tested it there.
-
Niels Kristian about 8 yearsAnother great tool to look at is: tatiyants.com/pev/#/plans/new
-
-
Niels Kristian over 11 yearsHi, thanks for your explanations, Just before I ran the query, I did a full vacuum
-
Craig Ringer over 11 years@NielsKristian Looks like milliseconds to me. At a guess you're reading it in DE style notation, eg "123.456.789,50" instead of US/AU/UK style "123,456,789.50". AFAIK Pg doesn't localize times in EXPLAIN ANALYZE, so it should be 35 milliseconds.
-
Craig Ringer over 11 years@NielsKristian Consider partitioning if all else fails; see edit to answer. Also, consider editing your question to show
EXPLAIN (ANALYZE, BUFFERS, VERBOSE)results. -
Niels Kristian over 11 yearsThanks for all the great help! I have surely gotten a whole lot more knowledge about debugging SQL. The solution turns out to reduce the number of columns in the table, and be more precise on what I select. Secondly I have made some better fitting indexes.
-
B Seven almost 6 yearsI'll keep this important info in mind. "close enough for military contracting accounting".
-
 Todd over 5 years@CraigRinger thanks for your detailed explanation. Would you mind also adding in a bit about the meanings behind the
costvalues? They seem arbitrary to me, just that "high is bad, low is good". -
Craig Ringer over 5 years@Todd Pretty much. The estimates are somewhat arbitrary costs in abstract units, based on number of expected random page fetches, sequential I/O page fetches, tuples processed in memory, etc.