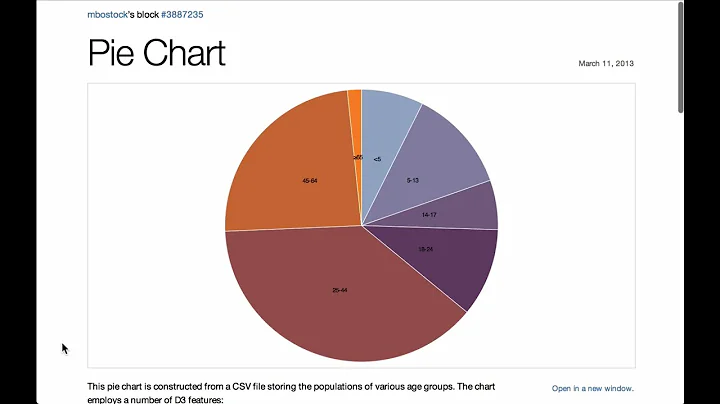
Label outside arc (Pie chart) d3.js
Solution 1
I can solve that problem - with trigonometry :).
See fiddle: http://jsfiddle.net/nrabinowitz/GQDUS/
Basically, calling arc.centroid(d) returns an [x,y] array. You can use the Pythagorean Theorem to calculate the hypotenuse, which is the length of the line from the center of the pie to the arc centroid. Then you can use the calculations x/h * desiredLabelRadius and y/h * desiredLabelRadius to calculate the desired x,y for your label anchor:
.attr("transform", function(d) {
    var c = arc.centroid(d),
        x = c[0],
        y = c[1],
        // pythagorean theorem for hypotenuse
        h = Math.sqrt(x*x + y*y);
    return "translate(" + (x/h * labelr) +  ',' +
       (y/h * labelr) +  ")";
})
The only downside here is that text-anchor: middle isn't a great choice anymore - you'd be better off setting the text-anchor based on which side of the pie we're on:
.attr("text-anchor", function(d) {
    // are we past the center?
    return (d.endAngle + d.startAngle)/2 > Math.PI ?
        "end" : "start";
})
Solution 2
Specifically for pie charts, the d3.layout.pie() function will format data with a startAngle and endAngle attributes. The radius can be whatever you desire (how far out from the center you would like to place the label).
Combining these pieces of information with a couple trigonometric functions lets you determine the x and y coordinates for labels.
Regarding the x/y positioning of the text, the magic is in this line (formatted for readability):
.attr("transform", function(d) {
  return "translate(" +
    ( (radius - 12) * Math.sin( ((d.endAngle - d.startAngle) / 2) + d.startAngle ) ) +
    ", " +
    ( -1 * (radius - 12) * Math.cos( ((d.endAngle - d.startAngle) / 2) + d.startAngle ) ) +
  ")";
 })
-
((d.endAngle - d.startAngle) / 2) + d.startAnglegives us our angle (theta) in radians. -
(radius - 12)is the arbitrary radius I chose for the position of the text. -
-1 *the y axis is inverted (see below).
The trig functions used are: cos = adjacent / hypotenuse and sin = opposite / hypotenuse. But there are a couple things we need to consider to make these work with our labels.
- 0 angle is at 12 o'clock.
- The angle still increases in a clockwise direction.
- The y axis is inverted from the standard cartesian coordinate system. Positive y is in the direction of 6 o'clock - down.
- Positive x is still in the direction of 3 o'clock - right.
That messes things up quite a bit and basically has the effect of swapping sin and cos. Our trig functions then become: sin = adjacent / hypotenuse and cos = opposite / hypotenuse.
Substituting variable names we have sin(radians) = x / r and cos(radians) = y / r. After some algebraic manipulation we can get both functions in terms of x and y respectively r * sin(radians) = x and r * cos(radians) = y. From there, just plug those into the transform/translate attribute.
That'll put the labels in the right location, to make them look fancy, you need some styling logic like this:
.style("text-anchor", function(d) {
    var rads = ((d.endAngle - d.startAngle) / 2) + d.startAngle;
    if ( (rads > 7 * Math.PI / 4 && rads < Math.PI / 4) || (rads > 3 * Math.PI / 4 && rads < 5 * Math.PI / 4) ) {
      return "middle";
    } else if (rads >= Math.PI / 4 && rads <= 3 * Math.PI / 4) {
      return "start";
    } else if (rads >= 5 * Math.PI / 4 && rads <= 7 * Math.PI / 4) {
      return "end";
    } else {
      return "middle";
    }
  })
This will make the labels from 10:30 o'clock to 1:30 o'clock and from 4:30 o'clock to 7:30 o'clock anchor in the middle (they are above and below), the labels from 1:30 o'clock to 4:30 o'clock anchor on the left (they are to the right), and the labels from 7:30 o'clock to 10:30 o'clock anchor on the right (they are to the left).
The same formulas can be used for any D3 radial graph, the only difference is how you determine the angle.
I hope this helps anyone stumbling across it!
Solution 3
Thanks!
I found a different way to solve this problem, but yours seems better :-)
I created a second arc with a bigger radius and used it to position my labels.
///// Arc Labels /////
// Calculate position
var pos = d3.svg.arc().innerRadius(r + 20).outerRadius(r + 20);

// Place Labels
arcs.append("svg:text")
       .attr("transform", function(d) { return "translate(" +
    pos.centroid(d) + ")"; })
       .attr("dy", 5)
       .attr("text-anchor", "middle")
       .attr("fill", function(d, i) { return colorL(i); }) //Colorarray Labels
       .attr("display", function(d) { return d.value >= 2 ? null : "none"; })
       .text(function(d, i) { return d.value.toFixed(0) + "%"});
Solution 4
I don't know if this helps but I was able to create arcs where I place text, both, on the arc and just outside it. In one case, where I place magnitudes of the arc within the arcs, I rotate the text on the arc to match the angle of the arc. In the other, where I place the text outside of the arc, it is simply horizontal. The code is located at: http://bl.ocks.org/2295263
My Best,
Frank
Solution 5
yes baby, it's SOHCAHTOA
function coordinates_on_circle(hyp, angle){
  var radian= angle * Math.PI / 180 //trig uses radians
  return {
    x: Math.cos(radian) * hyp, //adj = cos(r) * hyp
    y: Math.sin(radian) * hyp //opp = sin(r) * hyp
  }
}
var radius=100
var angle=45
coordinates_on_circle(radius, angle)Related videos on Youtube
 10 : 53
 16 : 56
 15 : 54
 16 : 56
 13 : 19
 08 : 55
Ibe Vanmeenen
Front-end Developer at Sweet Mustard. Founder of Anata Creative
Updated on July 22, 2020Comments
-
Ibe Vanmeenen almost 4 years
I'm new to d3.js and I"m trying to make a Pie-chart with it. I have only one problem: I can't get my labels outside my arcs... The labels are positioned with arc.centroid
arcs.append("svg:text")
    .attr("transform", function(d) {
        return "translate(" + arc.centroid(d) + ")";
    })
    .attr("text-anchor", "middle")
Who can help me with this?
-
Sean Wang about 11 yearsThis function calculated the center point of the pie slice for a pie graph. I add a function to get the center point of the arc. Below is image based on my new function . refer to link: github.com/mbostock/d3/issues/1124
-
 DeadlyChambers about 10 yearsSo if you want to go with a very nice looking legend instead of random text hanging around. I found a pretty good solution to labels. stackoverflow.com/questions/20675617/…
-
-
Peter Ehrlich over 11 yearsPoints for legibility right here! Is there a way to clone an existing arc, so that I could say
my_arc.clone.outerRadius(r + 20)instead of the fulld3.svg.arc()...? -
 daydreamer almost 11 yearsI tried your technique, but can't get it working almost correctly, the text doesn't fit the pie area plnkr.co/edit/VYH5QbO99ZbMkvc2D4Fe?p=preview
 -
nrabinowitz almost 11 yearsLooks like it works fine - you might want to set the
displaystyle of your label conditionally ond.endAngle - d.startAngle > someValue. -
Chris Pfohl about 10 years@PeterEhrlich you could always write a function that returns the radius you want. Write once use whenever you want.
-
 punstress about 9 yearsThis might be a slightly simpler way to push the text in or out from the centroid. First initialise centroid multiplier cm to a value, >1 to push out, <1 to squeeze in toward the center. Try cm=1.1 to start. The first term multiplies horizontally and the second vertically. .attr("transform", function(d) { return "translate(" + arc.centroid(d)[0]*cm + ", " + arc.centroid(d)[1]*cm + ")"; }) (sorry originally I posted pos/neg instead of >1/<1.)