Matplotlib add subtitle to figure
11,163
The error is correct, the pyplot library has no .subtitle function, only a .suptitle function.
So you should fix this with:
import matplotlib.pyplot as plt

plt.figure(figsize = (15, 80))
for i, audio, rate, name in zip(range(len(audios)), audios, rates, names):
    plt.subplot(len(audios), 1, i+1)
    plt.plot(rate, audio)
    plt.xlabel('Time (s)')
    plt.ylabel('Amplitude')
    plt.title(name)
plt.suptitle('Figure 1: Plot amplitude of signal')
plt.show()Related videos on Youtube
 14 : 51
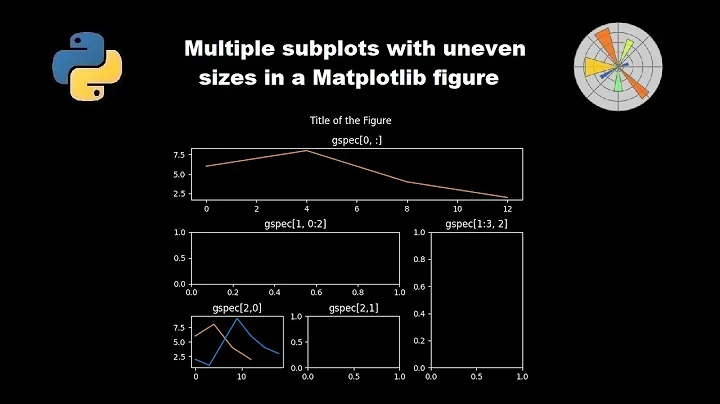
Multiple subplots with uneven sizes in a Matplotlib figure
 21 : 22
Matplotlib Tutorial (Part 10): Subplots
 06 : 22
Subplots with Matplotlib in Python
 06 : 58
Matplotlib Tutorial 3 - Axes labels, Legend, Grid
 04 : 13
How to save a matplotlib figure and fix text cutting off || Matplotlib Tips
 11 : 05
Add TEXT to MATPLOTLIB figures || Python matplotlib text with plt.text() || Matplotlib Tips
 04 : 17
Add shapes to matplotlib figures with matplotlib patches || Matplotlib Tips
Author by
Kathryn Schutte
Updated on June 04, 2022Comments
-
 Kathryn Schutte almost 2 years
I want to add a title to my figure that contains several subplots.
Here is my code:
    import matplotlib.pyplot as plt

    plt.figure(figsize = (15, 80))
    for i, audio, rate, name in zip(range(len(audios)), audios, rates, names):
        plt.subplot(len(audios), 1, i+1)
        plt.plot(rate, audio)
        plt.xlabel('Time (s)')
        plt.ylabel('Amplitude')
        plt.title(name)
    plt.subtitle('Figure 1: Plot amplitude of signal')
    plt.show()
The error I get is :
module 'matplotlib.pyplot' has no attribute 'subtitle'I can't figure out why this doesn't work since it is written that way in the matplotlib documentation ! Thank you for your help.-
 Willem Van Onsem over 5 yearsIt is
.suptitle, not.subtitle.
-
-
 Sheldore over 5 yearsShould have been posted as a comment given your golden badge and that it was a typo error but anyway
 -
Willem Van Onsem over 5 years@Bazingaa: I'm not really sure it was a typo in the "strict" sense. After all
.subtitlewould be a valid candidate. So I think it was not a "typing mistake". It is more a classical "misread" and then use it that way.