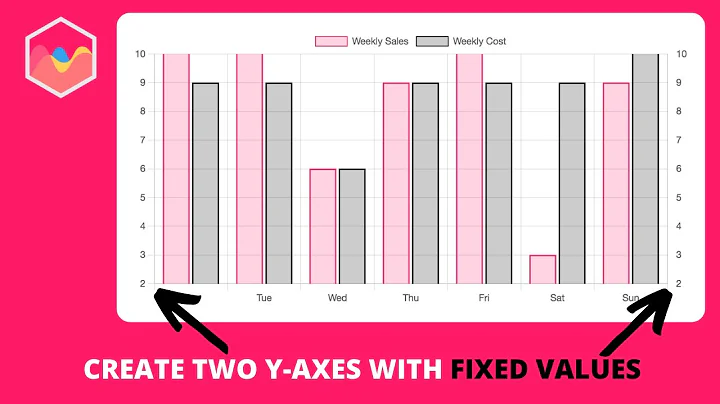
ng2-charts: How to set fixed range for y axis
Solution 1
Try adding the following to your chart options:
scales : {
  yAxes: [{
     ticks: {
        steps : 10,
        stepValue : 10,
        max : 100,
        min: 0
      }
  }]
}
https://github.com/valor-software/ng2-charts/issues/853
Solution 2
In my name.component.html:
<div style="display: block">
<canvas baseChart height="100" [datasets]="lineChartData" [labels]="lineChartLabels" [options]="lineChartOptions"
    [colors]="lineChartColors" [legend]="lineChartLegend" [chartType]="lineChartType"></canvas>
In my name.component.ts:
 public lineChartOptions: any = {
    scales : {
        yAxes: [{
            ticks: {
            beginAtZero: true,
                stepValue: 10,
                steps: 20,
              max : 50,
            }
        }]
      }
};
Solution 3
Yes you can do the same by using tickOption in the y Axes
public barChartOptions: ChartOptions = {
responsive: true,
showLines: false,
tooltips: {enabled: false},
animation: {duration: 2000},
scales: {
    yAxes: [{
        gridLines: {
            display:false
        },
        display: false,
        ticks: {
          max : 100,
          min: 0
        }
    }]
  }
};
Also, steps and stepValue is not working and I checked the same in their library its not written there also.
barChartData: ChartDataSets[] = [
          {
            data: [40, 30, 30],
            "backgroundColor": this.bgColors
          }
 ];
In the above, I need only y bar graphs so I set the data like that and for the three values, I used the same size of barChartLabels.
barChartLabels: Label[] = ['A', 'B', 'C'];
This works for me, I hope it will work in your code too :)
Related videos on Youtube
 06 : 06
 09 : 17
 07 : 49
 03 : 43
 36 : 20
 18 : 20
 01 : 03
 10 : 25
 11 : 32
 06 : 24
 04 : 20
 09 : 32
user2347528
Software Engineer since 2016. Experienced in: .Net, C# (web, windows, windows phone) ios apps with swift2 Angularjs 2 web applications Love to attend hackathons, meetups and bootcamps in and around Boston area.
Updated on June 04, 2022Comments
-
user2347528 almost 2 years
I have a chart.js chart using ng2-charts module. The chart shows Percentage on y axis and time on x axis. Is it possible to set y axis to show 0 to 100 instead of dynamic range based on data?