output.png from gnuplot is not as good as the figure from prompt shell
Solution 1
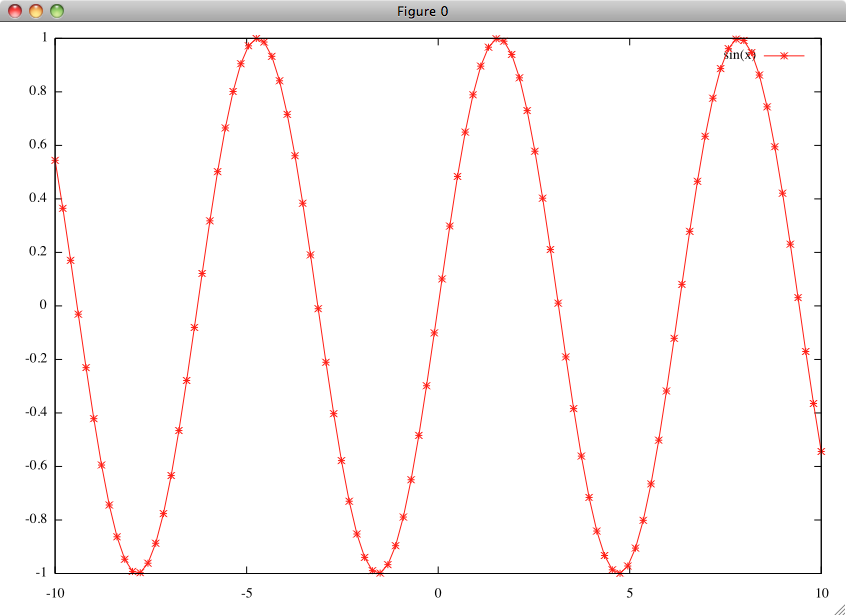
The source of your problems with the PNG quality is most likely the missing antialiasing in the png terminal of Gnuplot. Since you give no screenshots, I'm not sure what you mean when talking about bad linewidth, but here's how it looks for me (on MacOS). This screenshot shows the output of gnuplot's native aquaterm output:
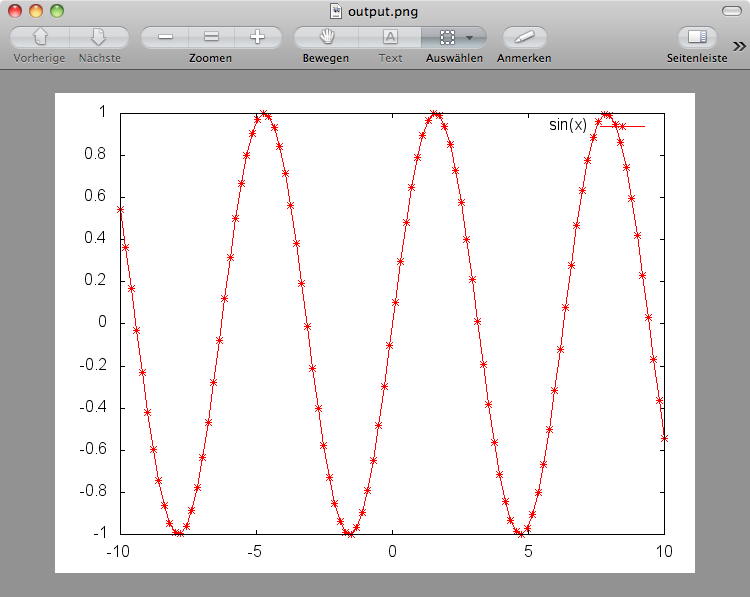
If we create a png using set term png, the lines become "jumpy" and pixellated:
However, there is a version of the png terminal that uses the Cairo libs for rendering, and that makes the output far more smooth and nicer. set term pngcairo gives this result:
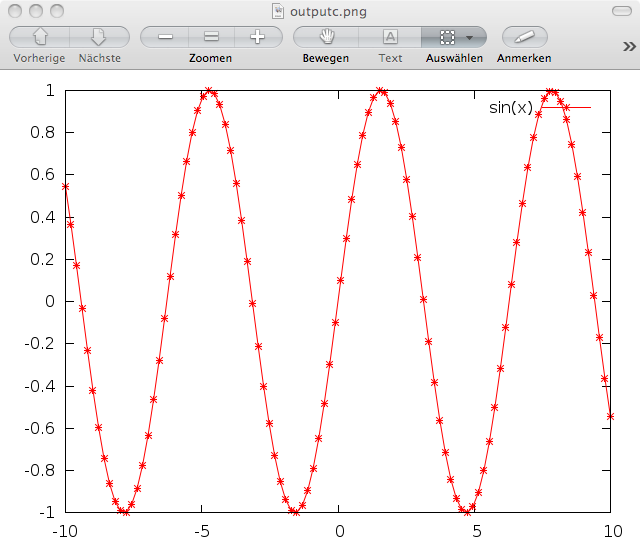
You can use set terminal to check whether this terminal version is available for you. If it is, this should save you conversion work and also give better image quality than a JPG (which is not an ideal format for line art).
Solution 2
The default size of the PNG image generated gnuplot with the PNG terminal is 640x480 pixels. This resolution in certain cases may result in "pixelated" graphs which are not as nice as those produced on screen with the default (wxt) terminal.
You can change the resolution of the output image using the size option:
set terminal png size <x,y>
where x and y are the desired numbers of pixels along the horizontal and vertical axis, respectively. For example:
set terminal png size 1024,768
Please note that, images with larger resolution will result in proportionally larger files on disk. Alternatively you can try to use non-raster terminals like "post eps" or "pdf" if available on your machine, which may give you high quality scalable and (relatively) portable images without a large disk footprint.
Solution 3
Alternatively, if you want professional (publication-ready) quality images with gnuplot, you should have a look at the epslatex terminal. I have used it extensively for my thesis and my papers with very nice results, virtually no pixelation problems, portability when converting images to pdf, and almost all the capabilities of Latex.
Alcott
college student, major in Mechanical Engineering. Love programming.
Updated on January 11, 2020Comments
-
 Alcott almost 3 years
I often plot graphs in
gnuplotprompt shell, like this:gunuplot> plot sin(x) with linespoints pointtype 3and the figure showed up is great.
Today, I save the graph in a
.pngfile, like this:gnuplot> set term png gnuplot> set output "output.png" gunuplot> plot sin(x) with linespoints pointtype 3Then, I open
output.pngwitheogin Ubuntu, like this:$ eog output.pngI found that, the output.png displayed in
eogis not as good as the figure plotted in prompt shell.Why is that? Do I need to adjust some settings before save the
output.png?PS
I found that a way around it, first,
set term postscript
set output "output.ps"
then in linux shell,
$ convert output.ps output.jpgThis way some sort of solve the my problem.