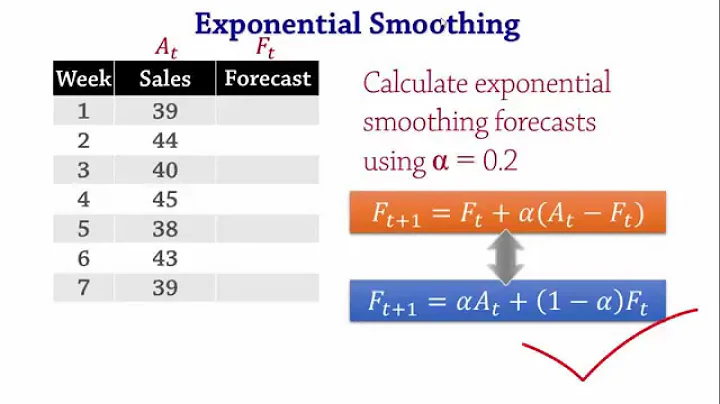
Pandas: Exponential smoothing function for column
15,952
Perhaps you are looking for an exponentially weighted moving average:
import pandas as pd
import datetime as DT

df = pd.DataFrame({
    'Trader': 'Carl Mark Carl Joe Mark Carl Max Max'.split(),
    'Quantity': [5, 2, 5, 10, 1, 5, 2, 1],
    'Date': [
        DT.datetime(2013, 1, 1, 13, 0),
        DT.datetime(2013, 1, 1, 13, 5),
        DT.datetime(2013, 2, 5, 20, 0),
        DT.datetime(2013, 2, 6, 10, 0),
        DT.datetime(2013, 2, 8, 12, 0),
        DT.datetime(2013, 3, 7, 14, 0),
        DT.datetime(2013, 6, 4, 14, 0),
        DT.datetime(2013, 7, 4, 14, 0),
        ]})

df.index = [df.Date, df.Trader]
df2 = df.unstack('Trader').resample('1W', how='mean').fillna(0)
print(df2.ewm(span=7).mean())
yields
            Quantity
Trader          Carl       Joe      Mark       Max
Date
2013-01-06  5.000000  0.000000  2.000000  0.000000
2013-01-13  2.142857  0.000000  0.857143  0.000000
2013-01-20  1.216216  0.000000  0.486486  0.000000
2013-01-27  0.771429  0.000000  0.308571  0.000000
2013-02-03  0.518566  0.000000  0.207426  0.000000
2013-02-10  1.881497  3.041283  0.448470  0.000000
2013-02-17  1.338663  2.163837  0.319081  0.000000
2013-02-24  0.966766  1.562696  0.230437  0.000000
2013-03-03  0.705454  1.140307  0.168151  0.000000
2013-03-10  1.843158  0.838219  0.123605  0.000000
2013-03-17  1.362049  0.619423  0.091341  0.000000
2013-03-24  1.010398  0.459502  0.067759  0.000000
2013-03-31  0.751651  0.341831  0.050407  0.000000
2013-04-07  0.560329  0.254823  0.037576  0.000000
2013-04-14  0.418350  0.190254  0.028055  0.000000
2013-04-21  0.312703  0.142209  0.020970  0.000000
2013-04-28  0.233936  0.106388  0.015688  0.000000
2013-05-05  0.175120  0.079640  0.011744  0.000000
2013-05-12  0.131154  0.059645  0.008795  0.000000
2013-05-19  0.098261  0.044687  0.006590  0.000000
2013-05-26  0.073637  0.033488  0.004938  0.000000
2013-06-02  0.055195  0.025101  0.003701  0.000000
2013-06-09  0.041378  0.018818  0.002775  0.500670
2013-06-16  0.031023  0.014108  0.002080  0.375377
2013-06-23  0.023261  0.010579  0.001560  0.281462
2013-06-30  0.017443  0.007933  0.001170  0.211057
2013-07-07  0.013080  0.005949  0.000877  0.408376
To concatenate this result with df2:
df3 = df2.ewm(span=7).mean()
df3.columns = pd.MultiIndex.from_tuples([('EWMA', item[1]) for item in df3.columns])
df2 = pd.concat([df2, df3], axis=1)

print(df2)
yields
            Quantity                      EWMA
Trader          Carl  Joe  Mark  Max      Carl       Joe      Mark       Max
Date
2013-01-06         5    0     2    0  5.000000  0.000000  2.000000  0.000000
2013-01-13         0    0     0    0  2.142857  0.000000  0.857143  0.000000
2013-01-20         0    0     0    0  1.216216  0.000000  0.486486  0.000000
2013-01-27         0    0     0    0  0.771429  0.000000  0.308571  0.000000
2013-02-03         0    0     0    0  0.518566  0.000000  0.207426  0.000000
2013-02-10         5   10     1    0  1.881497  3.041283  0.448470  0.000000
2013-02-17         0    0     0    0  1.338663  2.163837  0.319081  0.000000
2013-02-24         0    0     0    0  0.966766  1.562696  0.230437  0.000000
2013-03-03         0    0     0    0  0.705454  1.140307  0.168151  0.000000
2013-03-10         5    0     0    0  1.843158  0.838219  0.123605  0.000000
2013-03-17         0    0     0    0  1.362049  0.619423  0.091341  0.000000
2013-03-24         0    0     0    0  1.010398  0.459502  0.067759  0.000000
2013-03-31         0    0     0    0  0.751651  0.341831  0.050407  0.000000
2013-04-07         0    0     0    0  0.560329  0.254823  0.037576  0.000000
2013-04-14         0    0     0    0  0.418350  0.190254  0.028055  0.000000
2013-04-21         0    0     0    0  0.312703  0.142209  0.020970  0.000000
2013-04-28         0    0     0    0  0.233936  0.106388  0.015688  0.000000
2013-05-05         0    0     0    0  0.175120  0.079640  0.011744  0.000000
2013-05-12         0    0     0    0  0.131154  0.059645  0.008795  0.000000
2013-05-19         0    0     0    0  0.098261  0.044687  0.006590  0.000000
2013-05-26         0    0     0    0  0.073637  0.033488  0.004938  0.000000
2013-06-02         0    0     0    0  0.055195  0.025101  0.003701  0.000000
2013-06-09         0    0     0    2  0.041378  0.018818  0.002775  0.500670
2013-06-16         0    0     0    0  0.031023  0.014108  0.002080  0.375377
2013-06-23         0    0     0    0  0.023261  0.010579  0.001560  0.281462
2013-06-30         0    0     0    0  0.017443  0.007933  0.001170  0.211057
2013-07-07         0    0     0    1  0.013080  0.005949  0.000877  0.408376
Related videos on Youtube
Author by
Andy
Updated on June 04, 2022Comments
-
Andy almost 2 years
I have the following DataFrame with trading data:
df = pd.DataFrame({
'Trader': 'Carl Mark Carl Joe Mark Carl Max Max'.split(),
'Quantity': [5,2,5,10,1,5,2,1],
'Date' : [
DT.datetime(2013,1,1,13,0),
DT.datetime(2013,1,1,13,5),
DT.datetime(2013,2,5,20,0),
DT.datetime(2013,2,6,10,0),
DT.datetime(2013,2,8,12,0),
DT.datetime(2013,3,7,14,0),
DT.datetime(2013,6,4,14,0),
DT.datetime(2013,7,4,14,0),
]})

df.index = [df.Date, df.Trader]
I hope to compute weekly statistics for each trader with the average order volumes. To do so I am currently unstacking the trader column and resample the data using:
df.unstack('Trader').resample('1W', how='mean').fillna(0)Is there any possibility to compte also a column for each trader with a trend function for the trading volume (preferably a exponential smoothing function based on the previous trades of the trader) ?
Thanks
Andy
-
unutbu almost 11 years
df.unstack('Trader').fillna(0).resample('1W', how='mean')raises an error. Can you fix the example so we can understand your situation more clearly? -
Andy almost 11 yearsHi unutbu, thanks for your comment. Sorry, I forgot to specify the index separately. Have a try with the updated DataFrame. Thanks
-
-
Andy almost 11 yearsThank you unutbu for your answer, this is exactly what I was looking for. Is there any possibility to integrate this new dataframe into the original one? I would like to have both the actual and the trend in the same dataframe?
-
Pierre H. almost 6 yearsAs of pandas 0.18 (March 2016), the
pd.ewmafunction is deprecated, likepd.rolling_meanand similar functions for rolling statistics. The new approach is based on Exponentially Weighted Windows. In the code example,pd.ewma(df2, span=7)should becomedf2.ewm(span=7).mean().


