Pandas groupby two columns and plot
25,058
Solution 1
Various Methods of Groupby Plots
Data
import numpy as np
import pandas as pd
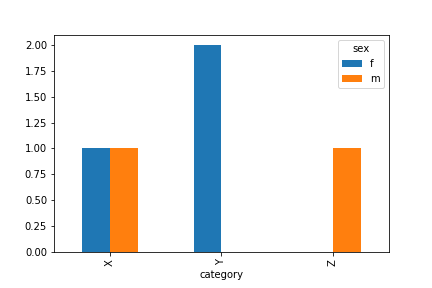
df = pd.DataFrame({'category': list('XYZXY'),
'sex': list('mfmff'),
'ThisColumnIsNotUsed': range(5,10)})
df
category sex ThisColumnIsNotUsed
0 X m 5
1 Y f 6
2 Z m 7
3 X f 8
4 Y f 9
Using crosstab
pd.crosstab(df['category'],df['sex']).plot.bar()
Using groupby+unstack:
(df.groupby(['sex','category'])
   .count().unstack('sex').plot.bar())
Using pivot_table:
pd.pivot_table(df,index = 'category',
               columns = 'sex',aggfunc ='count').plot.bar()
Using seaborn:
import seaborn as sns
sns.countplot(data=df,x='category',hue='sex')
or,
sns.catplot(data=df,kind='count',x='category',hue='sex')
output

Solution 2
IIUC,
df.groupby(['category','sex']).B.count().unstack().reset_index()\
.plot.bar(x = 'category', y = ['f', 'm'])
Edit: If you have multiple columns, you can use groupby, count and droplevel.
new_df = df.groupby(['category','sex']).count().unstack()
new_df.columns = new_df.columns.droplevel()
new_df.reset_index().plot.bar()
Solution 3
You can also use this
pd.pivot_table(df, values = 'B', index = 'category', columns = 'sex',
               aggfunc = lambda x: len(x)).plot.bar()
which results in exactly the same plot.
Related videos on Youtube
49 : 06
Python Pandas Tutorial (Part 8): Grouping and Aggregating - Analyzing and Exploring Your Data
 06 : 57
How to use groupby() to group categories in a pandas DataFrame
06 : 43
Plot Grouped Bar Graph With Python and Pandas
01 : 20
Pandas : Pandas groupby two columns and plot
04 : 01
8B-Pandas GroupBy Sum | Pandas Get Sum Values in Multiple Columns | GroupBy Sum In Pandas Dataframe
Author by
BhishanPoudel
Data Scientist II at Amerisourcebergen Ph.D. Astrophysics
Updated on December 27, 2021Comments
-
 BhishanPoudel over 1 year
I have a dataframe like this:
import numpy as np
import pandas as pd
import matplotlib.pyplot as plt
%matplotlib inline
df = pd.DataFrame({'category': list('XYZXY'), 'B': range(5,10),'sex': list('mfmff')})
I want to plot count of sex male or female based on category from column 'category'.
I tried:
df.groupby(['category','sex'])['category','sex'].count().plot.bar()But this gives:

How do I get the count of sex per category?
-
Vaishali over 4 years@ScottBoston, haha. Great minds?;) Wish you a very happy new year!
-
 Scott Boston over 4 years@Vaishali Happy 2019!
 -
BhishanPoudel over 4 yearsHappy new year to you all guys, also small followup, what to do if I have more than three columns, like
B,C,D, etc. ? Can we choose any of the other column, or the chosen column must have unique values ? -
Vaishali over 4 years@astro123, pl see the edit. And happy new year to you:)
-
 Jason Goal about 4 yearseverything run smoothly but the figure does not show up, why?
 -
Vaishali about 4 years@Jason Goal, You need plt.show() at the end of the code
-
kirti purohit over 2 yearsHello , I have a similar problem it would be really helpful if you could please help me out with this -StackOverflow