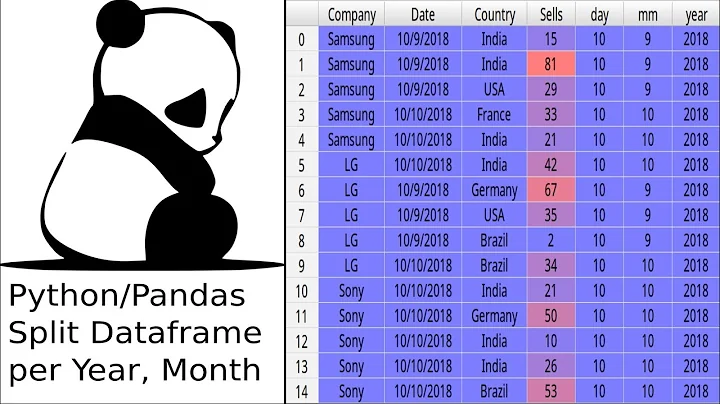
Pandas - Split dataframe into multiple dataframes based on dates?
Solution 1
If you must loop, you need to unpack the key and the dataframe when you iterate over a groupby object:
import pandas as pd
import numpy as np
import statsmodels.api as sm
from patsy import dmatrices

df = pd.read_csv('data.csv')
df['date'] = pd.to_datetime(df['date'], format='%Y%m%d')
df = df.set_index('date')
Note the use of group_name here:
for group_name, df_group in df.groupby(pd.Grouper(freq='M')):
    y,X = dmatrices('value1 ~ value2 + value3', data=df_group,
    return_type='dataframe')
If you want to avoid iteration, do have a look at the notebook in Paul H's gist (see his comment), but a simple example of using apply would be:
def do_regression(df_group, ret='outcome'):
    """Apply the function to each group in the data and return one result."""
    y,X = dmatrices('value1 ~ value2 + value3',
                    data=df_group,
                    return_type='dataframe')
    if ret == 'outcome':
        return y
    else:
        return X

outcome = df.groupby(pd.Grouper(freq='M')).apply(do_regression, ret='outcome')
Solution 2
This is a split per year.
import pandas as pd
import dateutil.parser
dfile = 'rg_unificado.csv'
df = pd.read_csv(dfile, sep='|', quotechar='"', encoding='latin-1')
df['FECHA'] = df['FECHA'].apply(lambda x: dateutil.parser.parse(x))
#http://pandas.pydata.org/pandas-docs/stable/timeseries.html#offset-aliases
#use to_period
per = df['FECHA'].dt.to_period("Y")
#group by that period
agg = df.groupby([per])
for year, group in agg:
    #this simple save the data
    datep =  str(year).replace('-', '')
    filename = '%s_%s.csv' % (dfile.replace('.csv', ''), datep)
    group.to_csv(filename, sep='|', quotechar='"', encoding='latin-1', index=False, header=True)
Related videos on Youtube
Alex F
Updated on September 14, 2022Comments
-
Alex F over 1 year
I have a dataframe with multiple columns along with a date column. The date format is 12/31/15 and I have set it as a datetime object.
I set the datetime column as the index and want to perform a regression calculation for each month of the dataframe.
I believe the methodology to do this would be to split the dataframe into multiple dataframes based on month, store into a list of dataframes, then perform regression on each dataframe in the list.
I have used groupby which successfully split the dataframe by month, but am unsure how to correctly convert each group in the groupby object into a dataframe to be able to run my regression function on it.
Does anyone know how to split a dataframe into multiple dataframes based on date, or a better approach to my problem?
Here is my code I've written so far
import pandas as pd import numpy as np import statsmodels.api as sm from patsy import dmatrices df = pd.read_csv('data.csv') df['date'] = pd.to_datetime(df['date'], format='%Y%m%d') df = df.set_index('date') # Group dataframe on index by month and year # Groupby works, but dmatrices does not for df_group in df.groupby(pd.TimeGrouper("M")): y,X = dmatrices('value1 ~ value2 + value3', data=df_group, return_type='dataframe')-
Paul H about 8 yearsyou can just use
df.groupby(...).apply. No need to loop. I don't have time to type out a full answer. Here's a notebook I made that demonstrates something similar: gist.github.com/phobson/…
-
-
Alex F about 8 yearsThis is exactly what I did yesterday by using the "group_name". Thanks for your comment.
-
dexteritas over 5 years
pd.TimeGrouper()was formally deprecated in pandas v0.21.0 in favor ofpd.Grouper()(see this question).


