Pass Pandas DataFrame to Scipy.optimize.curve_fit
Your call to curve_fit is incorrect. From the documentation:
xdata : An M-length sequence or an (k,M)-shaped array for functions with k predictors.
The independent variable where the data is measured.
ydata : M-length sequence
The dependent data — nominally f(xdata, ...)
In this case your independent variables xdata are the columns A to D, i.e. table[['A', 'B', 'C', 'D']], and your dependent variable ydata is table['Z_real'].
Also note that xdata should be a (k, M) array, where k is the number of predictor variables (i.e. columns) and M is the number of observations (i.e. rows). You should therefore transpose your input dataframe so that it is (4, M) rather than (M, 4), i.e. table[['A', 'B', 'C', 'D']].T.
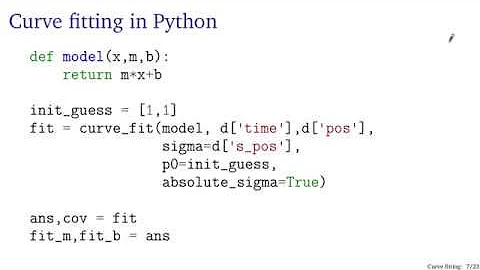
The whole call to curve_fit might look something like this:
curve_fit(func, table[['A', 'B', 'C', 'D']].T, table['Z_real'])
Here's a complete example showing multiple linear regression:
import numpy as np
import pandas as pd
from scipy.optimize import curve_fit

X = np.random.randn(100, 4)     # independent variables
m = np.random.randn(4)          # known coefficients
y = X.dot(m)                    # dependent variable

df = pd.DataFrame(np.hstack((X, y[:, None])),
                  columns=['A', 'B', 'C', 'D', 'Z_real'])

def func(X, *params):
    return np.hstack(params).dot(X)

popt, pcov = curve_fit(func, df[['A', 'B', 'C', 'D']].T, df['Z_real'],
                       p0=np.random.randn(4))

print(np.allclose(popt, m))
# True
Related videos on Youtube
 11 : 37
 51 : 26
 13 : 36
 24 : 50
 06 : 33
Sman789
Updated on September 15, 2022Comments
-
Sman789 over 1 year
I'd like to know the best way to use Scipy to fit Pandas DataFrame columns. If I have a data table (Pandas DataFrame) with columns (
A,B,C,DandZ_real) where Z depends on A, B, C and D, I want to fit a function of each DataFrame row (Series) which makes a prediction for Z (Z_pred).The signature of each function to fit is
func(series, param_1, param_2...)where series is the Pandas Series corresponding to each row of the DataFrame. I use the Pandas Series so that different functions can use different combinations of columns.
I've tried passing the DataFrame to
scipy.optimize.curve_fitusingcurve_fit(func, table, table.loc[:, 'Z_real'])but for some reason each func instance is passed the whole datatable as its first argument rather than the Series for each row. I've also tried converting the DataFrame to a list of Series objects, but this results in my function being passed a Numpy array (I think because Scipy performs a conversion from a list of Series to a Numpy array which doesn't preserve the Pandas Series object).
-
Sman789 over 8 yearsThankyou for your reply. I have tried this, but the first argument sent to func is still the whole (now transposed and cropped) DataFrame rather than the series corresponding to each row which it should be. The reason that I didn't crop the table before was that
funcitself isolates the values in each series that it needs to use (as different fitting functions use different combinations of independent variables), so if it Z_real is included in the Series it gets passed then it makes no difference. -
ali_m over 8 yearsIt would be helpful if you showed your
funcdefinition - it sounds like it has a signature which is incompatible with whatcurve_fitexpects -
Sman789 over 8 yearsI've changed the code to fit the documentation as closely as possible (including using Numpy instead of Pandas) but I get much the same problem.
func(X, p1, p2)is now of the formreturn p1*X[0] + p2*X[1]and I am calling the fitting function ascurve_fit(func, xdata, ydata)wherexdatais a 2x111 array andydatais a length 111 array. The problem is that putting a print function insidefuncstill shows X being equal to xdata (a 2x111 array), rather than a particular column of xdata(a 2x1 array). -
ali_m over 8 yearsI don't understand why you expect
Xto be a single column ofxdata. In my example theXparameter that gets passed tofuncisdf[['A', 'B', 'C', 'D']].T, i.e. a (4, 100) DataFrame, not a single column. For multiple linear regression you need all of those columns because you are predictingyby performing a sum over the values of your independent variables weighted by your parameter vector. -
Sman789 over 8 yearsThen perhaps I am simply using the wrong Scipy function for the job. In my question,
funcpredicts a single value of Z given a single value for each of A, B, C and D with some constant parameters (iez_i = func(a_i, b_i, c_i|params) = p_1*a_i + p_2*b_i + p_3*c_i), althoughfuncshould be able to be an arbitrary-order function fitting that signature. I want to find the optimum parameters to give the best overall prediction of Z given those inputs, using my table of experimental data. -
ali_m over 8 yearsThe example you just described is identical to my linear regression code above. If you want to predict Z given A, B, C and D then A, B, C and D are all independent variables and you should pass a (4, M) array or DataFrame as the
xdataparameter. (There are much more efficient ways to do linear regression than usingcurve_fit, though). -
Sman789 over 8 yearsI think I see what you've done, which is to vectorize your function so that it operates on the whole A, B, C and D column vectors and returns a Z_pred vector. My real
funcis piecewise and includes if statements, however, so in its current form really does need to be passed each set of values one at a time. I think this can still be done using Numpy arrays, but I was hoping for a method (outside of putting a for loop insidefunc) which would allow me to keep func's logic as it is. -
ali_m over 8 yearsLet us continue this discussion in chat.