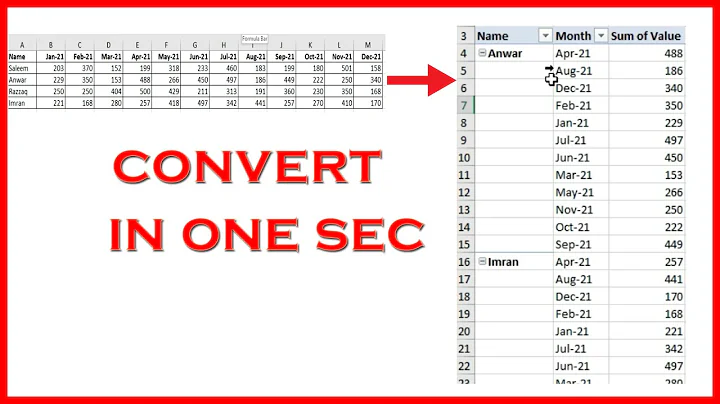
Pivoting rows into columns
Solution 1
Using the reshape package.
First, melt your data.frame:
x <- melt(df)
Then cast:
dcast(x, Color ~ Which + variable)
Depending on which version of the reshape package you're working with it could be cast() (reshape) or dcast() (reshape2)
Voila.
Solution 2
The cast function from the reshape package (not to be confused with the reshape function in base R) can do this and many other things. See here: http://had.co.nz/reshape/
Solution 3
To add to the options (many years later)....
The typical approach in base R would involve the reshape function (which is generally unpopular because of the multitude of arguments that take time to master). It's a pretty efficient function for smaller datasets, but doesn't always scale well.
reshape(mydf, direction = "wide", idvar = "Color", timevar = "Which")
#   Color Response.Control Count.Control Response.Treatment Count.Treatment
# 1   Red                2            10                  1              14
# 2  Blue                3            20                  4              21
Already covered are cast/dcast from the "reshape" and "reshape2" (and now, dcast.data.table from "data.table", especially useful when you have large datasets). But also from the Hadleyverse, there's "tidyr", which works nicely with the "dplyr" package:
library(tidyr)
library(dplyr)
mydf %>%
  gather(var, val, Response:Count) %>%  ## make a long dataframe
  unite(RN, var, Which) %>%             ## combine the var and Which columns
  spread(RN, val)                       ## make the results wide
#   Color Count_Control Count_Treatment Response_Control Response_Treatment
# 1  Blue            20              21                3                  4
# 2   Red            10              14                2                  1
Also to note would be that in a forthcoming version of "data.table", the dcast.data.table function should be able to handle this without having to first melt your data.
The data.table implementation of dcast allows you to convert multiple columns to a wide format without melting it first, as follows:
library(data.table)
dcast(as.data.table(mydf), Color ~ Which, value.var = c("Response", "Count"))
#    Color Response_Control Response_Treatment Count_Control Count_Treatment
# 1:  Blue                3                  4            20              21
# 2:   Red                2                  1            10              14
Solution 4
Reshape does indeed work for pivoting a skinny data frame (e.g., from a simple SQL query) to a wide matrix, and is very flexible, but it's slow. For large amounts of data, very very slow. Fortunately, if you only want to pivot to a fixed shape, it's fairly easy to write a little C function to do the pivot fast.
In my case, pivoting a skinny data frame with 3 columns and 672,338 rows took 34 seconds with reshape, 25 seconds with my R code, and 2.3 seconds with C. Ironically, the C implementation was probably easier to write than my (tuned for speed) R implementation.
Here's the core C code for pivoting floating point numbers. Note that it assumes that you have already allocated a correctly sized result matrix in R before calling the C code, which causes the R-devel folks to shudder in horror:
#include <R.h>
#include <Rinternals.h>
/*
 * This mutates the result matrix in place.
 */
SEXP
dtk_pivot_skinny_to_wide(SEXP n_row  ,SEXP vi_1  ,SEXP vi_2  ,SEXP v_3  ,SEXP result)
{
   int ii, max_i;
   unsigned int pos;
   int nr = *INTEGER(n_row);
   int * aa = INTEGER(vi_1);
   int * bb = INTEGER(vi_2);
   double * cc = REAL(v_3);
   double * rr = REAL(result);
   max_i = length(vi_2);
   /*
    * R stores matrices by column.  Do ugly pointer-like arithmetic to
    * map the matrix to a flat vector.  We are translating this R code:
    *    for (ii in 1:length(vi.2))
    *       result[((n.row * (vi.2[ii] -1)) + vi.1[ii])] <- v.3[ii]
    */
   for (ii = 0; ii < max_i; ++ii) {
      pos = ((nr * (bb[ii] -1)) + aa[ii] -1);
      rr[pos] = cc[ii];
      /* printf("ii: %d \t value: %g \t result index:  %d \t new value: %g\n", ii, cc[ii], pos, rr[pos]); */
   }
   return(result);
}
Related videos on Youtube
 05 : 20
 05 : 19
 04 : 38
 16 : 18
 08 : 54
 06 : 43
 04 : 56
grautur
Updated on July 09, 2022Comments
-
 grautur almost 2 years
Suppose (to simplify) I have a table containing some control vs. treatment data:
Which, Color, Response, Count
Control, Red, 2, 10
Control, Blue, 3, 20
Treatment, Red, 1, 14
Treatment, Blue, 4, 21
For each color, I want a single row with the control and treatment data, i.e.:
Color, Response.Control, Count.Control, Response.Treatment, Count.Treatment
Red, 2, 10, 1, 14
Blue, 3, 20, 4, 21
I guess one way of doing this is by using an internal merge on each control/treatment subset (merging on the Color column), but is there a better way? I was thinking the reshape package or the stack function could somehow do it, but I'm not sure.
-
 Brandon Bertelsen over 13 yearsIf you create a workable data.frame with something like d.put(head(df,20)) it works wonders for those of us trying to answer
-
-
grautur over 13 yearsOh, yep, I meant the reshape package. I wasn't sure how to use cast to do what I want, though? One close way is by doing cast(data, position ~ variable | which), but this puts the control/treatment in a list, rather than in the columns.
-
zwol over 13 yearsI don't remember exactly, but I'm pretty sure the reshape package's documentation has an example of doing exactly this. You have to tell it how you want the column names constructed.
-
user1700890 about 7 yearsThank you for
reshapeexample. I believe yourreshapeexample along with original question should be added toreshapefunction official documentation. -
 user3726345 over 4 yearsHopefully this can be addressed in a comment, in the OP's question the cells contain 'Count' values and is an integer datatype. How would I cast to show a string values in the cells? eg Count has values of 'ABC123' 'ABD124' etc