Please explain in detail 2D Histogram in Python
Suppose you have a 1D array, you plot the position of its values on the x axis, they are so dense that you can't tell the spatial distribution, you use a 1D histogram to show the distribution by count of boxes along the x axis. Problem solved.
Then you have two 1D arrays, a list of 2D dots in (x, y) axes. You plot their positions on the x-y plane, again they are so dense and overlap with each other. You want to view the distribution better by count of boxes in the plane, so you try a 2D diagram. Problem solved.
Here is an example
import numpy as np
import matplotlib.pyplot as plt

%matplotlib inline

# prepare 2D random dots centered at (0, 0)
n = 100000
x = np.random.randn(n)
y = x + np.random.randn(n)

# plot data
fig1 = plt.figure()
plt.plot(x,y,'.r')
plt.xlabel('x')
plt.ylabel('y')
gives

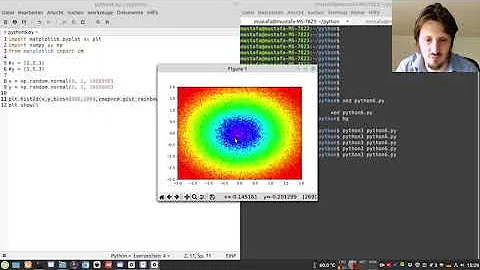
# plot 2D histogram using pcolor
fig2 = plt.figure()
plt.hist2d(x, y, bins=100)
plt.xlabel('x')
plt.ylabel('y')
cbar = plt.colorbar()
cbar.ax.set_ylabel('Counts')
gives

Related videos on Youtube
![[DS] Học Matplotlib (Histograms)](https://i.ytimg.com/vi/26o-anlWPic/hq720.jpg?sqp=-oaymwEcCNAFEJQDSFXyq4qpAw4IARUAAIhCGAFwAcABBg==&rs=AOn4CLCHZcMvSqIgQUQgVhJBacCGU01qAw) 17 : 41
17 : 41
 27 : 11
 04 : 14
 02 : 28
 16 : 36
 16 : 11
 05 : 14
 20 : 35
![[coding python] - Thống kê histogram của ảnh và hiển thị](https://i.ytimg.com/vi/mGUkrOdGhEU/hqdefault.jpg?sqp=-oaymwEcCOADEI4CSFXyq4qpAw4IARUAAIhCGAFwAcABBg==&rs=AOn4CLAKgiBuyxNkMPCS4sIYbv6d8m9vmg) 09 : 34
09 : 34
 09 : 47
 09 : 38
Steve
Updated on September 15, 2022Comments
-
Steve over 1 year
I am trying to understand what are the values of a 2D histogram.
I have 2 numpy arrays of the same length X and Y (float numbers in each one).
For example the first 10 values of X: [ 88, 193, 60, 98, 78, 100, 75, 76, 130]
and Y: [ 18. , 9. , 36.1, 18.5, 34.3, 32.9, 32.2, 22. , 15. ]
When I use:
import matplotlib.pyplot as plt

plt.hist2d(X,Y, bins=(10,20))
I get a 2D histogram.
But what does it mean?
1D histogram simply shows me how much of each item I have.
Please explain me what does it mean in 2D.
Thanks in advance!