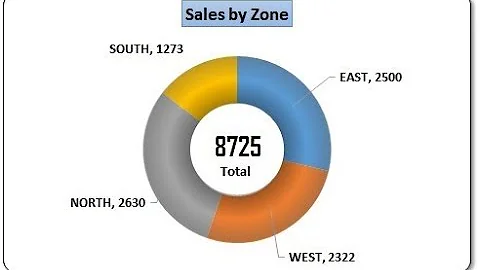
Put sum of values in center of doughnut chart?
Solution 1
There is a plugin for what you want to do: https://github.com/ciprianciurea/chartjs-plugin-doughnutlabel
Solution 2
As a workaround until the open issue is complete, you could just draw your own total on the canvas element itself.
You will have to manually calculate the x/y position on the canvas (like [150,100] in this example).
var canvas=document.getElementById("myChart");
var ctx=canvas.getContext("2d");
ctx.font="36px verdana";
ctx.fillText("76",150,100);
Solution 3
I actually ended up doing this:
<div style="position: relative;" data-bind="dxPieChart: {
  //chart initialization code from above...
}">
    <div style="position: absolute; top: 50%; margin-top: -15px; left: 50%; font-size: 30px; line-height: 30px; margin-left: -50px; width: 100px; text-align: center;" data-bind="text: alarmIDs().length"></div>
    <div style="position: absolute; top: 50%; margin-top: 15px; left: 50%; font-size: 15px; line-height: 15px; margin-left: -50px; width: 100px; text-align: center;">alarms</div>
</div>
When it binds the chart it doesn't overwrite any internal HTML, so this works brilliantly.
Related videos on Youtube
 40 : 21
 19 : 26
 17 : 48
 07 : 11
 28 : 53
 03 : 48
 10 : 57
THE JOATMON
Hobbies include off-roading, gaming, reading and infuriating SO users by attempting to write code myself. "I must create a system, or be enslaved by another man's; I will not reason and compare: my business is to create." - William Blake
Updated on September 15, 2022Comments
-
 THE JOATMON over 1 year
I'm drawing this pie chart:

using this code:
dxPieChart: {
    dataSource: dsAlarmsBySeverity,
    size: {
        width: 275,
        height: 150
    },
    palette: ['#FFFF00', '#FF9900', '#CC3300', '#33CC33', '#0066FF'],
    legend: {
        backgroundColor: '#FCFCFC',
        border: {
                color: 'black',
                width: .5,
                visible: true,
                cornerRadius: 10
        },
        verticalAlign: 'middle'
    },
    series: [{
        type: 'doughnut',
        argumentField: 'severity',
        valueField: 'count',
        label: {
            visible: false,
            font: {
                size: 16
            },
            connector: {
                visible: true,
                width: 0.5
            },
            position: 'columns',
            customizeText: function(arg) {
                return arg.argumentText
            }
        },
        border: {
            color: 'black',
            width: .5,
            visible: true
        },
        hoverStyle: {
            border: {
                color: 'black',
                width: .5,
                visible: true
            }
        }
    }]
}
Is there a way to add the sum of all values to the center of the donut? Like so:

-
Saravana Kumar over 10 yearsThis feature is an open issue in github
-
John ArcherThe issue @SaravanaKumar refers to has been closed. You could use this plugin now: github.com/ciprianciurea/chartjs-plugin-doughnutlabel
-
-
Ben almost 4 yearsis there a way to disable the labels in doughnut chart and only show the label in the center of the chart? When using the plugin the chart labels are always shown, even when tooltips and legend are disabled. here an example forked from the offical github documentation: stackblitz.com/edit/…
-
John Archer almost 4 years@Ben It is a bit strange, as the example on ciprianciurea.github.io/chartjs-plugin-doughnutlabel/samples/… doesn't show the labels. But the Angluar app seems to have this "bug"!? And I can't see the difference in the codes. Maybe you should open an issue on theit Git hub page.
-
Ben almost 4 yearsadding the following code to plugins option solved the issue for me: datalabels: { display: false }