Python 3d scatterplot colormap issue
ax.scatter can take a color parameter c which is a sequence (e.g. a list or an array) of scalars, and a cmap parameter to specify a color map. So to make the colors vary according to the magnitude of the voltages, you could define:
c = np.abs(v)
This makes positive and negative voltages have the same color. If instead you wished each color (positive or negative) to have its own color, you could just use c = v.
For example,
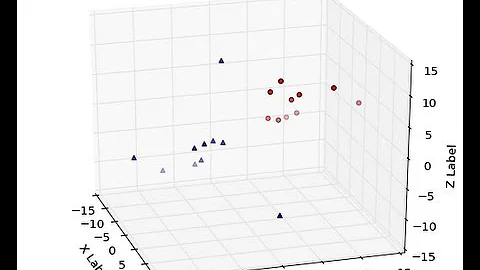
import matplotlib.pyplot as plt
from mpl_toolkits.mplot3d import Axes3D
import numpy as np
x, y, z, v = (np.random.random((4,100))-0.5)*15
c = np.abs(v)

fig = plt.figure()
ax = fig.add_subplot(111, projection='3d')
cmhot = plt.get_cmap("hot")
cax = ax.scatter(x, y, z, v, s=50, c=c, cmap=cmhot)

plt.show()

Related videos on Youtube
 07 : 52
 05 : 38
 11 : 09
 09 : 48
 17 : 24
 36 : 57
 01 : 09
Comments
-
 samanthapants almost 2 years
I have four dimensional data (x, y, z displacements; and respective voltages) which I wish to plot in a 3d scatterplot in python. I've gotten the 3d plot to render, but I want to have the colour of the points change using a colourmap, dependent upon the magnitude of the point's voltage.
I've tried a few things, but can't seem to get it to work I'm getting the error
ValueError: Cannot convert argument type <type 'numpy.ndarray'> to rgba array. I'm not sure exactly how to convert what I need to convert, so if anybody could please offer some help, I'd be most appreciative.My code is here:
fig = plt.figure()
from mpl_toolkits.mplot3d import Axes3D
cmhot = plt.cm.get_cmap("hot")
ax = fig.add_subplot(111, projection='3d',)
ax.scatter(x, y, z, v, s=50, c = cmhot)
plt.show()